
- Title
-
The little skate genome and the evolutionary emergence of wing-like fins
- Authors
- Marlétaz, F., de la Calle-Mustienes, E., Acemel, R.D., Paliou, C., Naranjo, S., Martínez-García, P.M., Cases, I., Sleight, V.A., Hirschberger, C., Marcet-Houben, M., Navon, D., Andrescavage, A., Skvortsova, K., Duckett, P.E., González-Rajal, Á., Bogdanovic, O., Gibcus, J.H., Yang, L., Gallardo-Fuentes, L., Sospedra, I., Lopez-Rios, J., Darbellay, F., Visel, A., Dekker, J., Shubin, N., Gabaldón, T., Nakamura, T., Tena, J.J., Lupiáñez, D.G., Rokhsar, D.S., Gómez-Skarmeta, J.L.
- Source
- Full text @ Nature

a, Adult little skate (L. erinacea) and skeletal staining using Alcian Blue and Alizarin Red. b, Chronogram showing the branching and divergence time of chondrichthyan and selected osteichthyan lineages (Supplementary Fig. 1). c, Morphological differences in the skeleton between the pectoral fins in shark and skate highlighting the expansion of a wing-like fin. The illustrations were reproduced from a previous publication60. d, Pairwise Hi-C contact density between 40 skate chromosomes, showing an increased interchromosomal interaction between the smallest ones (microchromosomes). The colour scale shows log-transformed observed/expected interchromosomal Hi-C contacts. Macro., macrochromosome; meso., mesochromosome; micro., microchromosome. e, Little skate chromosome classification based on the relationship between their size and GC percentage, highlighting the high GC content of microchromosomes. |
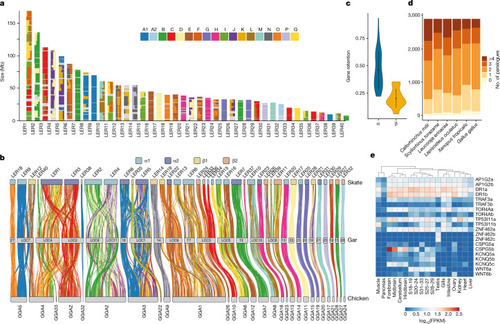
a, The fraction of genes derived from each CLG (depicted as squares named A1–Q) in skate chromosomes represented for bins of 20 genes. b, The syntenic orthology relationship between skate, gar and chicken, relying on genes with a significant CLG assignment in regard to amphioxus. Skate chromosomes are coloured by segmental identity and links are coloured by CLG. c, Rates of gene retention for α or β segments derived from the second alloploid event of vertebrate WGD. d, Respective gene-family composition for ohnologues in selected jawed vertebrate species indicating differential paralogue loss. e, Gene expression for selected sets of differentially lost ohnologues for which a copy was lost in the gnathostome but not in the chondrichthyan lineage. FPKM, fragments per kilobase of transcript per million mapped reads; S, stage. |
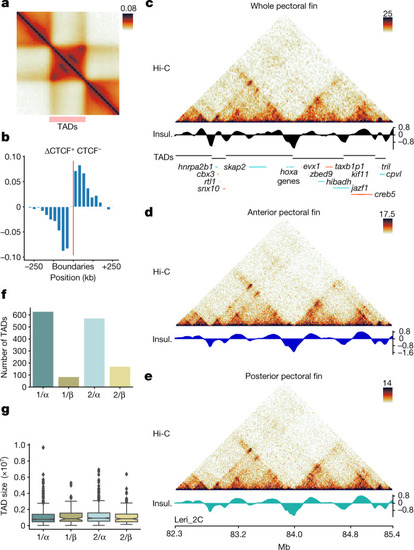
a, TAD metaplot displaying focal interactions at the apex of domains. b, Orientation bias of CTCF-binding site motifs inside ATAC–seq peaks at TAD boundary regions. c, Hi-C maps from whole pectoral fins of the skate hoxa locus at 25 kb resolution, denoting the presence of bipartite TAD configuration. Insul., insulation score. d,e, Hi-C maps from the same locus of c from dissected anterior (d) and posterior (e) portions of skate pectoral fins at 10 kb resolution. No changes in TADs or looping patterns were observed. f, The number of TADs detected associated to the different paralogous segments descending from the two rounds of WGD (1 or 2 for the 1R; α or β for the 2R) g, TAD sizes observed in the different paralogous segments from f. The box plots show the median (centre line) and the first and third quartiles (Q1 and Q3; box limits), and the whiskers extend to the last point within 1.5× the interquartile range below and above Q1 and Q3, respectively. The rest of the observations, including the maximum and minimum values, are shown as outliers. n = 626 (1/α), n = 83 (1/β), n = 570 (2/α) and n = 169 (2/β) TADs. |
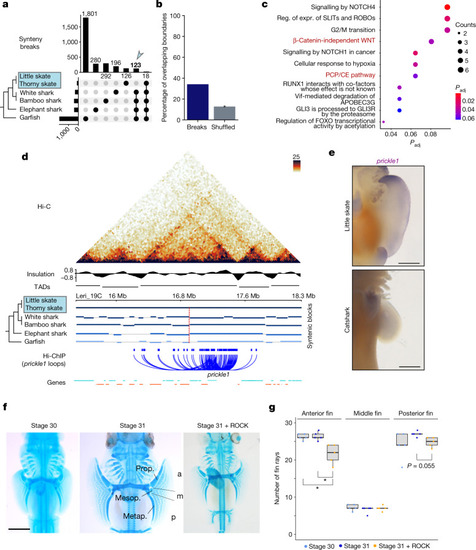
a, Upset plot for quantification of synteny breaks in vertebrate species with the skate genome as a reference. The bar plot at the top shows quantification of synteny breaks for the species combination indicated by dots. The blue arrow highlights the 123 synteny breaks found in non-skate species, therefore probably derived in skates. The bar plot on the left shows the total quantification of synteny breaks for individual species. b, The percentage of synteny breaks at TAD boundaries (dark blue) and the expected percentage for shuffled boundaries (grey). c, Reactome signalling pathway analysis of genes contained in rearranged TADs. expr., expression; Padj, adjusted P; reg., regulation. d, Hi-C map from pectoral fins for the prickle1 locus. Synteny blocks, insulation scores, TAD predictions and chromatin loops detected in H3K4me3 HiChIP datasets are indicated. e, WISH analysis of prickle1 in skates (L. erinacea, stage 30) and catshark (Scyliorhinus retifer, stage 30). Note that anterior expression is skate specific. n = 5 animals. Scale bars, 1 mm. f, Cartilage staining of embryos with or without ROCK inhibitor. Compared with the stage 30 and 31 controls, the number of fin rays decreased in embryos treated with ROCK inhibitor. Note the more severe reduction in fin rays in the anterior compared with in the posterior pectoral fin. Photographs of all replicates are provided in Extended Data Fig.11 and Supplementary Fig.10. Scale bar, 2 mm. The pectoral fin was divided into three domains from anterior to posterior (Methods). Prop., propterygium; mesop., mesopterygium; metap., metapterygium; a, anterior; m, middle; p, posterior. g, Quantification of the number of rays emerging from propterygium, mesopterygium and metapterygium in samples for the conditions shown in f. Individual data points are shown. The box plots show the median (centre line), Q1 and Q3 (box limits), and the whiskers extend to the last point within 1.5× the interquartile range below and above Q1 and Q3, respectively. P values were calculated using pairwise Wilcoxon rank-sum tests with correction for false-discovery rate (FDR); *P < 0.05; P = 0.018 in both significant comparisons in anterior fin. |
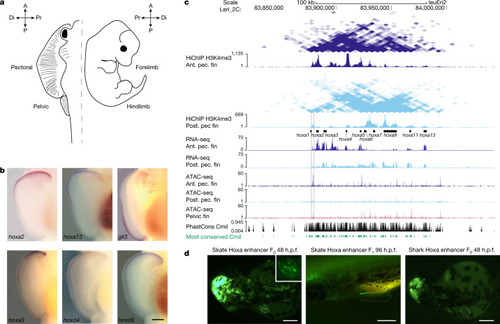
a, Outline of a skate and a mouse embryo and their homologous appendages, used in our comparative analyses. A, anterior; P, posterior. The distal (Di) and proximal (Pr) regions of the fin/limb are indicated. b, In situ hybridization reveals the opposite expression pattern of many hox genes and the gli3 gene in the pectoral fin. n = 8 animals for each gene. Scale bar, 1 mm. The images of hoxa2 and gli3 were adapted from ref. 1. c, UCSC Genome Browser view showing HiChIP, RNA-seq and ATAC–seq data around the hoxa cluster in skate. The anterior-specific open chromatin region between the hoxa1 and hoxa2 genes is marked with a dotted rectangle (see ‘A skate-specific hoxa fin enhancer’ section). Green denotes the most conserved regions with the elephant shark (Callorhinchus milii; Cmil) genome. Ant. pec. fin, anterior pectoral fin; post. pec. fin, posterior pectoral fin. d, GFP expression driven by the anterior-specific open chromatin region between the hoxa1 and hoxa2 genes from skate and shark in transgenic assays in zebrafish. The brain expression induced by the midbrain enhancer:egfp indicates a successful injection of the mini-Tol2 vector61 with the skate or shark hox enhancer as a positive control. Note that only the skate enhancer drives expression on the pectoral fin (5 eGFP-positive embryos at 48 h after fertilization (h.p.f.) out of 18 F0 embryos for the skate enhancer (left), in contrast to 0 out of 31 F0 embryos for the shark enhancer (right)). In F1 stable embryos, the GFP is driven to the pectoral fin with a clear anterior pattern at 96 h after fertilization (middle). Scale bars, 250 µm. |