
|
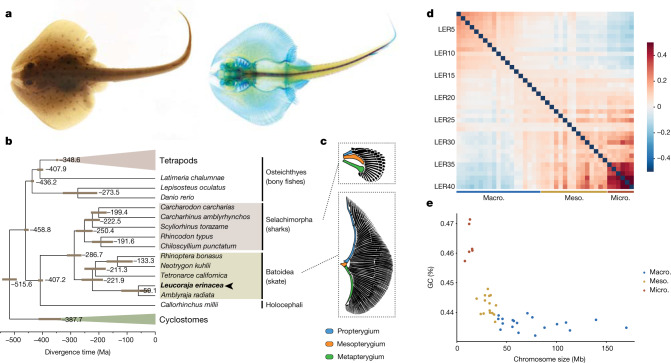
Fig. 1
a, Adult little skate (L. erinacea) and skeletal staining using Alcian Blue and Alizarin Red. b, Chronogram showing the branching and divergence time of chondrichthyan and selected osteichthyan lineages (Supplementary Fig. 1). c, Morphological differences in the skeleton between the pectoral fins in shark and skate highlighting the expansion of a wing-like fin. The illustrations were reproduced from a previous publication60. d, Pairwise Hi-C contact density between 40 skate chromosomes, showing an increased interchromosomal interaction between the smallest ones (microchromosomes). The colour scale shows log-transformed observed/expected interchromosomal Hi-C contacts. Macro., macrochromosome; meso., mesochromosome; micro., microchromosome. e, Little skate chromosome classification based on the relationship between their size and GC percentage, highlighting the high GC content of microchromosomes.