
Fig. 4
- ID
- ZDB-FIG-230423-11
- Publication
- Marlétaz et al., 2023 - The little skate genome and the evolutionary emergence of wing-like fins
- Other Figures
- All Figure Page
- Back to All Figure Page
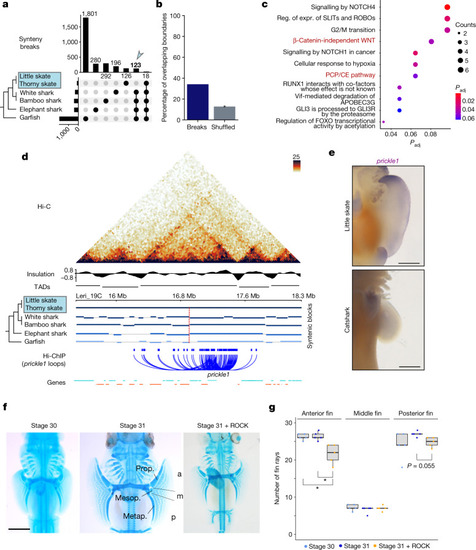
a, Upset plot for quantification of synteny breaks in vertebrate species with the skate genome as a reference. The bar plot at the top shows quantification of synteny breaks for the species combination indicated by dots. The blue arrow highlights the 123 synteny breaks found in non-skate species, therefore probably derived in skates. The bar plot on the left shows the total quantification of synteny breaks for individual species. b, The percentage of synteny breaks at TAD boundaries (dark blue) and the expected percentage for shuffled boundaries (grey). c, Reactome signalling pathway analysis of genes contained in rearranged TADs. expr., expression; Padj, adjusted P; reg., regulation. d, Hi-C map from pectoral fins for the prickle1 locus. Synteny blocks, insulation scores, TAD predictions and chromatin loops detected in H3K4me3 HiChIP datasets are indicated. e, WISH analysis of prickle1 in skates (L. erinacea, stage 30) and catshark (Scyliorhinus retifer, stage 30). Note that anterior expression is skate specific. n = 5 animals. Scale bars, 1 mm. f, Cartilage staining of embryos with or without ROCK inhibitor. Compared with the stage 30 and 31 controls, the number of fin rays decreased in embryos treated with ROCK inhibitor. Note the more severe reduction in fin rays in the anterior compared with in the posterior pectoral fin. Photographs of all replicates are provided in Extended Data Fig.11 and Supplementary Fig.10. Scale bar, 2 mm. The pectoral fin was divided into three domains from anterior to posterior (Methods). Prop., propterygium; mesop., mesopterygium; metap., metapterygium; a, anterior; m, middle; p, posterior. g, Quantification of the number of rays emerging from propterygium, mesopterygium and metapterygium in samples for the conditions shown in f. Individual data points are shown. The box plots show the median (centre line), Q1 and Q3 (box limits), and the whiskers extend to the last point within 1.5× the interquartile range below and above Q1 and Q3, respectively. P values were calculated using pairwise Wilcoxon rank-sum tests with correction for false-discovery rate (FDR); *P < 0.05; P = 0.018 in both significant comparisons in anterior fin. |