
- Title
-
Assessment of Nonalcoholic Fatty Liver Disease Symptoms and Gut-Liver Axis Status in Zebrafish after Exposure to Polystyrene Microplastics and Oxytetracycline, Alone and in Combination
- Authors
- Zhou, W., Shi, W., Du, X., Han, Y., Tang, Y., Ri, S., Ju, K., Kim, T., Huang, L., Zhang, W., Yu, Y., Tian, D., Yu, Y., Chen, L., Wu, Z., Liu, G.
- Source
- Full text @ Environ. Health Perspect.

(A) Lipid droplet staining using Oil Red O (n =6 and randomly selected images presented as representatives), (B) numbers of lipid droplets per millimeter squared (n = 3), and (C) quantified area of lipid droplets to that of the whole tissue observed (n = 3) in zebrafish livers after 28-d exposure to control, MPs, OTC, and MP-OTC, respectively. The black arrows in (A) indicate lipid droplets (Lds) (magnification at 200x and scale bar: 100μm). Numbers of lipid droplets were counted manually and the percentages of lipid droplet area to that of the whole tissue observed were estimated with ImageJ in (B) and (C), respectively. The corresponding numeric data of (B) and (C) are provided in Table S4. Data (means±SEs) with different superscripts above were significantly different at p<0.05 (one-way analysis of variance and Tukey’s post hoc tests). Note: MP-OTC, microplastics and oxytetracycline; MPs, microplastics; OTC, oxytetracycline; SE, standard error. |
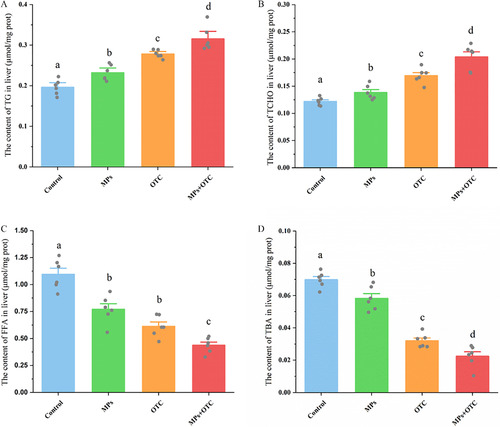
The contents of (A) triglycerides (TGs), (B) total cholesterol (TCHO), (C) free fatty acids (FFAs), and (D) total bile acids (TBAs) in zebrafish livers after 28-d exposure to control, MPs, OTC, and MP-OTC, respectively (n=6 for each experimental group). All parameters were determined using corresponding commercial kits [BC0625, BC1985, and BC0595 (Solarbio) and E003-2-1 (Njjcbio), respectively] with a microplate reader (Multiskan GO; Thermo Scientific) and standardized with the protein content of the sample. The corresponding numeric data are provided in Table S5. Data (means±SEs) with different superscripts above were significantly different at p<0.05 (one-way analysis of variance and Tukey’s post hoc tests). Note: MP-OTC, microplastics and oxytetracycline; MPs, microplastics; OTC, oxytetracycline; prot, protein; SE, standard error. |
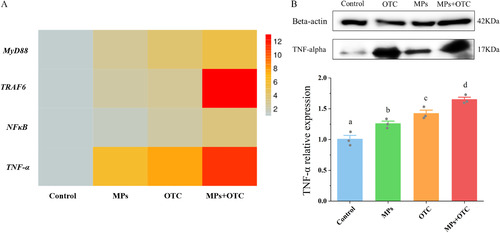
(A) Expression levels of inflammation-related genes and (B) western blot of TNF-α in zebrafish livers after 28-d exposure to control, MPs, OTC, and MP-OTC, respectively (n=3 for each experimental group for both gene expression and western blot analyses). Gene expressions were determined by real-time PCR with a Bio-Rad real-time system (CFX96; Bio-Rad) and the relative TNF-α expression levels were quantified using ImageJ. The corresponding numeric data are provided in Table S6. Data (means±SEs) with different superscripts above were significantly different at p<0.05 (one-way analysis of variance and Tukey’s post hoc tests). Note: MDA, malondialdehyde; MP-OTC, microplastics and oxytetracycline; MPs, microplastics; OTC, oxytetracycline; PCR, polymerase chain reaction; ROS, reactive oxygen species; SE, standard error; TNF-α, tumor necrosis factor-α. |
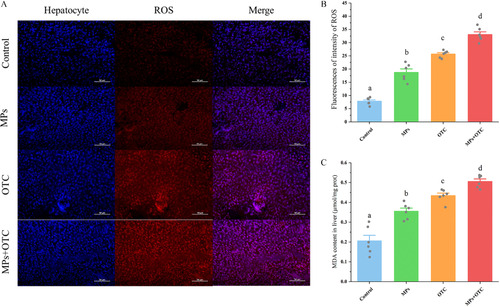
(A) ROS-specific fluorescent staining, (B) quantified ROS fluorescent intensities, and (C) MDA contents in zebrafish livers after 28-d exposure to control, MPs, OTC, and MP-OTC, respectively [n=6 for each experimental group, and randomly selected images are presented as representatives for (A)]. The hepatocyte and ROS were stained in blue (DAPI) and red (DHE) in (A), respectively (magnification at 400× and scale bar: 50μm). The ROS-specific fluorescence intensity was determined using ImageJ and the MDA content was measured with a commercial kit (BC0025; Solarbio) using a microplate reader (Multiskan GO; Thermo Scientific). The corresponding numeric data are provided in Table S7. Data (means±SEs) with different superscripts above in (B) and (C) were significantly different between groups at p<0.05 (one-way analysis of variance and Tukey’s post hoc tests). Note: DAPI, 4′,6-diamidino-2-phenylindole; DHE, dihydroethidium; MDA, malondialdehyde; MP-OTC, microplastics and oxytetracycline; MPs, microplastics; OTC, oxytetracycline; prot, protein; ROS, reactive oxygen species; SE, standard error. |
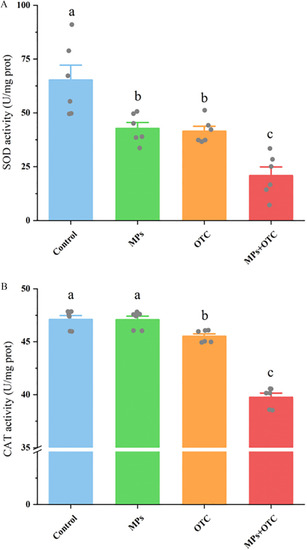
The activities of (A) SOD and (B) CAT in zebrafish livers after 28-d exposure to control, MPs, OTC, and MP-OTC, respectively (n=6 for each experimental group). The enzymatic activities of SOD and CAT were measured with corresponding commercial kits (BC0175 and BC0205, respectively; Solarbio) using a microplate reader (Multiskan GO; Thermo Scientific). The corresponding numeric data are provided in Table S8. Data (means±SEs) with different superscripts above were significantly different at p<0.05 (one-way analysis of variance and Tukey’s post hoc tests). Note: CAT, catalase; MP-OTC, microplastics and oxytetracycline; MPs, microplastics; OTC, oxytetracycline; prot, protein; SE, standard error; SOD, superoxide dismutase. |
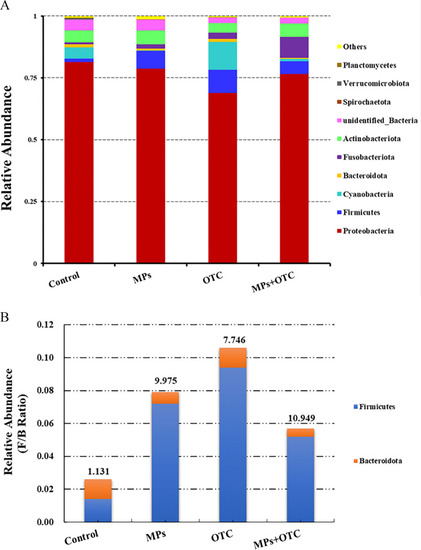
The (A) top 10 abundant microbial phyla and the (B) Firmicutes/Bacteroidetes ratios of the gut content microbiome of zebrafish after 28-d exposure to control, MPs, OTC, and MP-OTC, respectively (n=3 for each experimental group). Microbiome of gut contents (under accession number of PRJNA890774 in NCBI database) were obtained by Illumina-based high-throughput sequencing (Novogene Co., Ltd.). Different microbial phyla are labeled with different colors and corresponding phyla names are listed on the right side in (A). Blue and orange colors in (B) indicate the relative abundance of Firmicutes and Bacteroidetes, respectively. The corresponding numeric data for (A) are provided in Table S9. The number above each data column in (B) indicates the Firmicutes/Bacteroidetes ratio for the corresponding experimental group. Note: F/B, Firmicutes/Bacteroidetes (ratio); MP-OTC, microplastics and oxytetracycline; MPs, microplastics; NCBI, National Center for Biotechnology Information; OTC, oxytetracycline. |

(A) Histological images of intestines and (B) quantified intestinal goblet cell densities in zebrafish exposed to control, MPs, OTC, and MP-OTC, respectively [n=6 for both analysis for each experimental group, and randomly selected images are presented as representatives for (A)]. The images of intestines presented in (A) were stained with H&E. The magnification and scale bar were 200× and 100μm for (A), respectively. Goblet cells are indicated by black arrows in (A). The corresponding numeric data for (B) are provided in Table S10. Data (means±SEs) with different superscripts above were significantly different at p<0.05 (one-way analysis of variance and Tukey’s post hoc tests). Note: H&E, hematoxylin and eosin; MP-OTC, microplastics and oxytetracycline; MPs, microplastics; OTC, oxytetracycline; SE, standard error. |

MDA contents in the intestines of zebrafish after 28-d exposure to control, MPs, OTC, and MP-OTC, respectively (n=6 for each experimental group). The MDA content was measured with a commercial kit (BC0025; Solarbio) using a microplate reader (Multiskan GO; Thermo Scientific) and standardized with the protein content of the sample. The corresponding numeric data are provided in Table S11. Data (means±SEs) with different superscripts above were significantly different at p<0.05 (one-way analysis of variance and Tukey’s post hoc tests). Note: MDA, malondialdehyde; MP-OTC, microplastics and oxytetracycline; MPs, microplastics; OTC, oxytetracycline; prot, protein; SE, standard error. |

(A) LPS contents in serum (n=6 for each experimental group) and (B) expression levels of LBP in the livers (n=3 for each experimental group of zebrafish after 28-d exposure to control, MPs, OTC, and MP-OTC, respectively). The LPS content in the sample was measured with the commercial LPS ELISA kit (JL13861; Jonln Biotechnology) using a microplate reader (Multiskan GO; Thermo Scientific), and LBP expression was determined by real-time PCR with a Bio-Rad real-time system (CFX96; Bio-Rad). The corresponding numeric data are provided in Table S12. Data (means±SEs) with different superscripts above were significantly different at p<0.05 (one-way analysis of variance and Tukey’s post hoc tests). Note: ELISA, enzyme-linked immunosorbent assay; LBP, gene encoding lipopolysaccharide binding receptor; LPS, lipopolysaccharide; MP-OTC, microplastics and oxytetracycline; MPs, microplastics; OTC, oxytetracycline; PCR, polymerase chain reaction; prot, protein; SE, standard error. |

(A) Activities of lipase (n=6 for each experimental group) and (B) expressions of LIP (n=3 for each experimental group) in zebrafish livers after 28-d exposure to control, MPs, OTC, and MP-OTC, respectively. The activity of lipase was determined with the commercial lipase activity kit (BC2345; Solarbio) using a microplate reader (Multiskan GO; Thermo Scientific) and LIP expression was determined by real-time PCR with a Bio-Rad real-time system (CFX96; Bio-Rad). The corresponding numeric data are provided in Table S13. Data (means±SEs) with different superscripts above were significantly different at p<0.05 (one-way analysis of variance and Tukey’s post hoc tests). Note: LIP, gene encoding lipase; MP-OTC, microplastics and oxytetracycline; MPs, microplastics; OTC, oxytetracycline; PCR, polymerase chain reaction; prot, protein; SE, standard error. |