
|
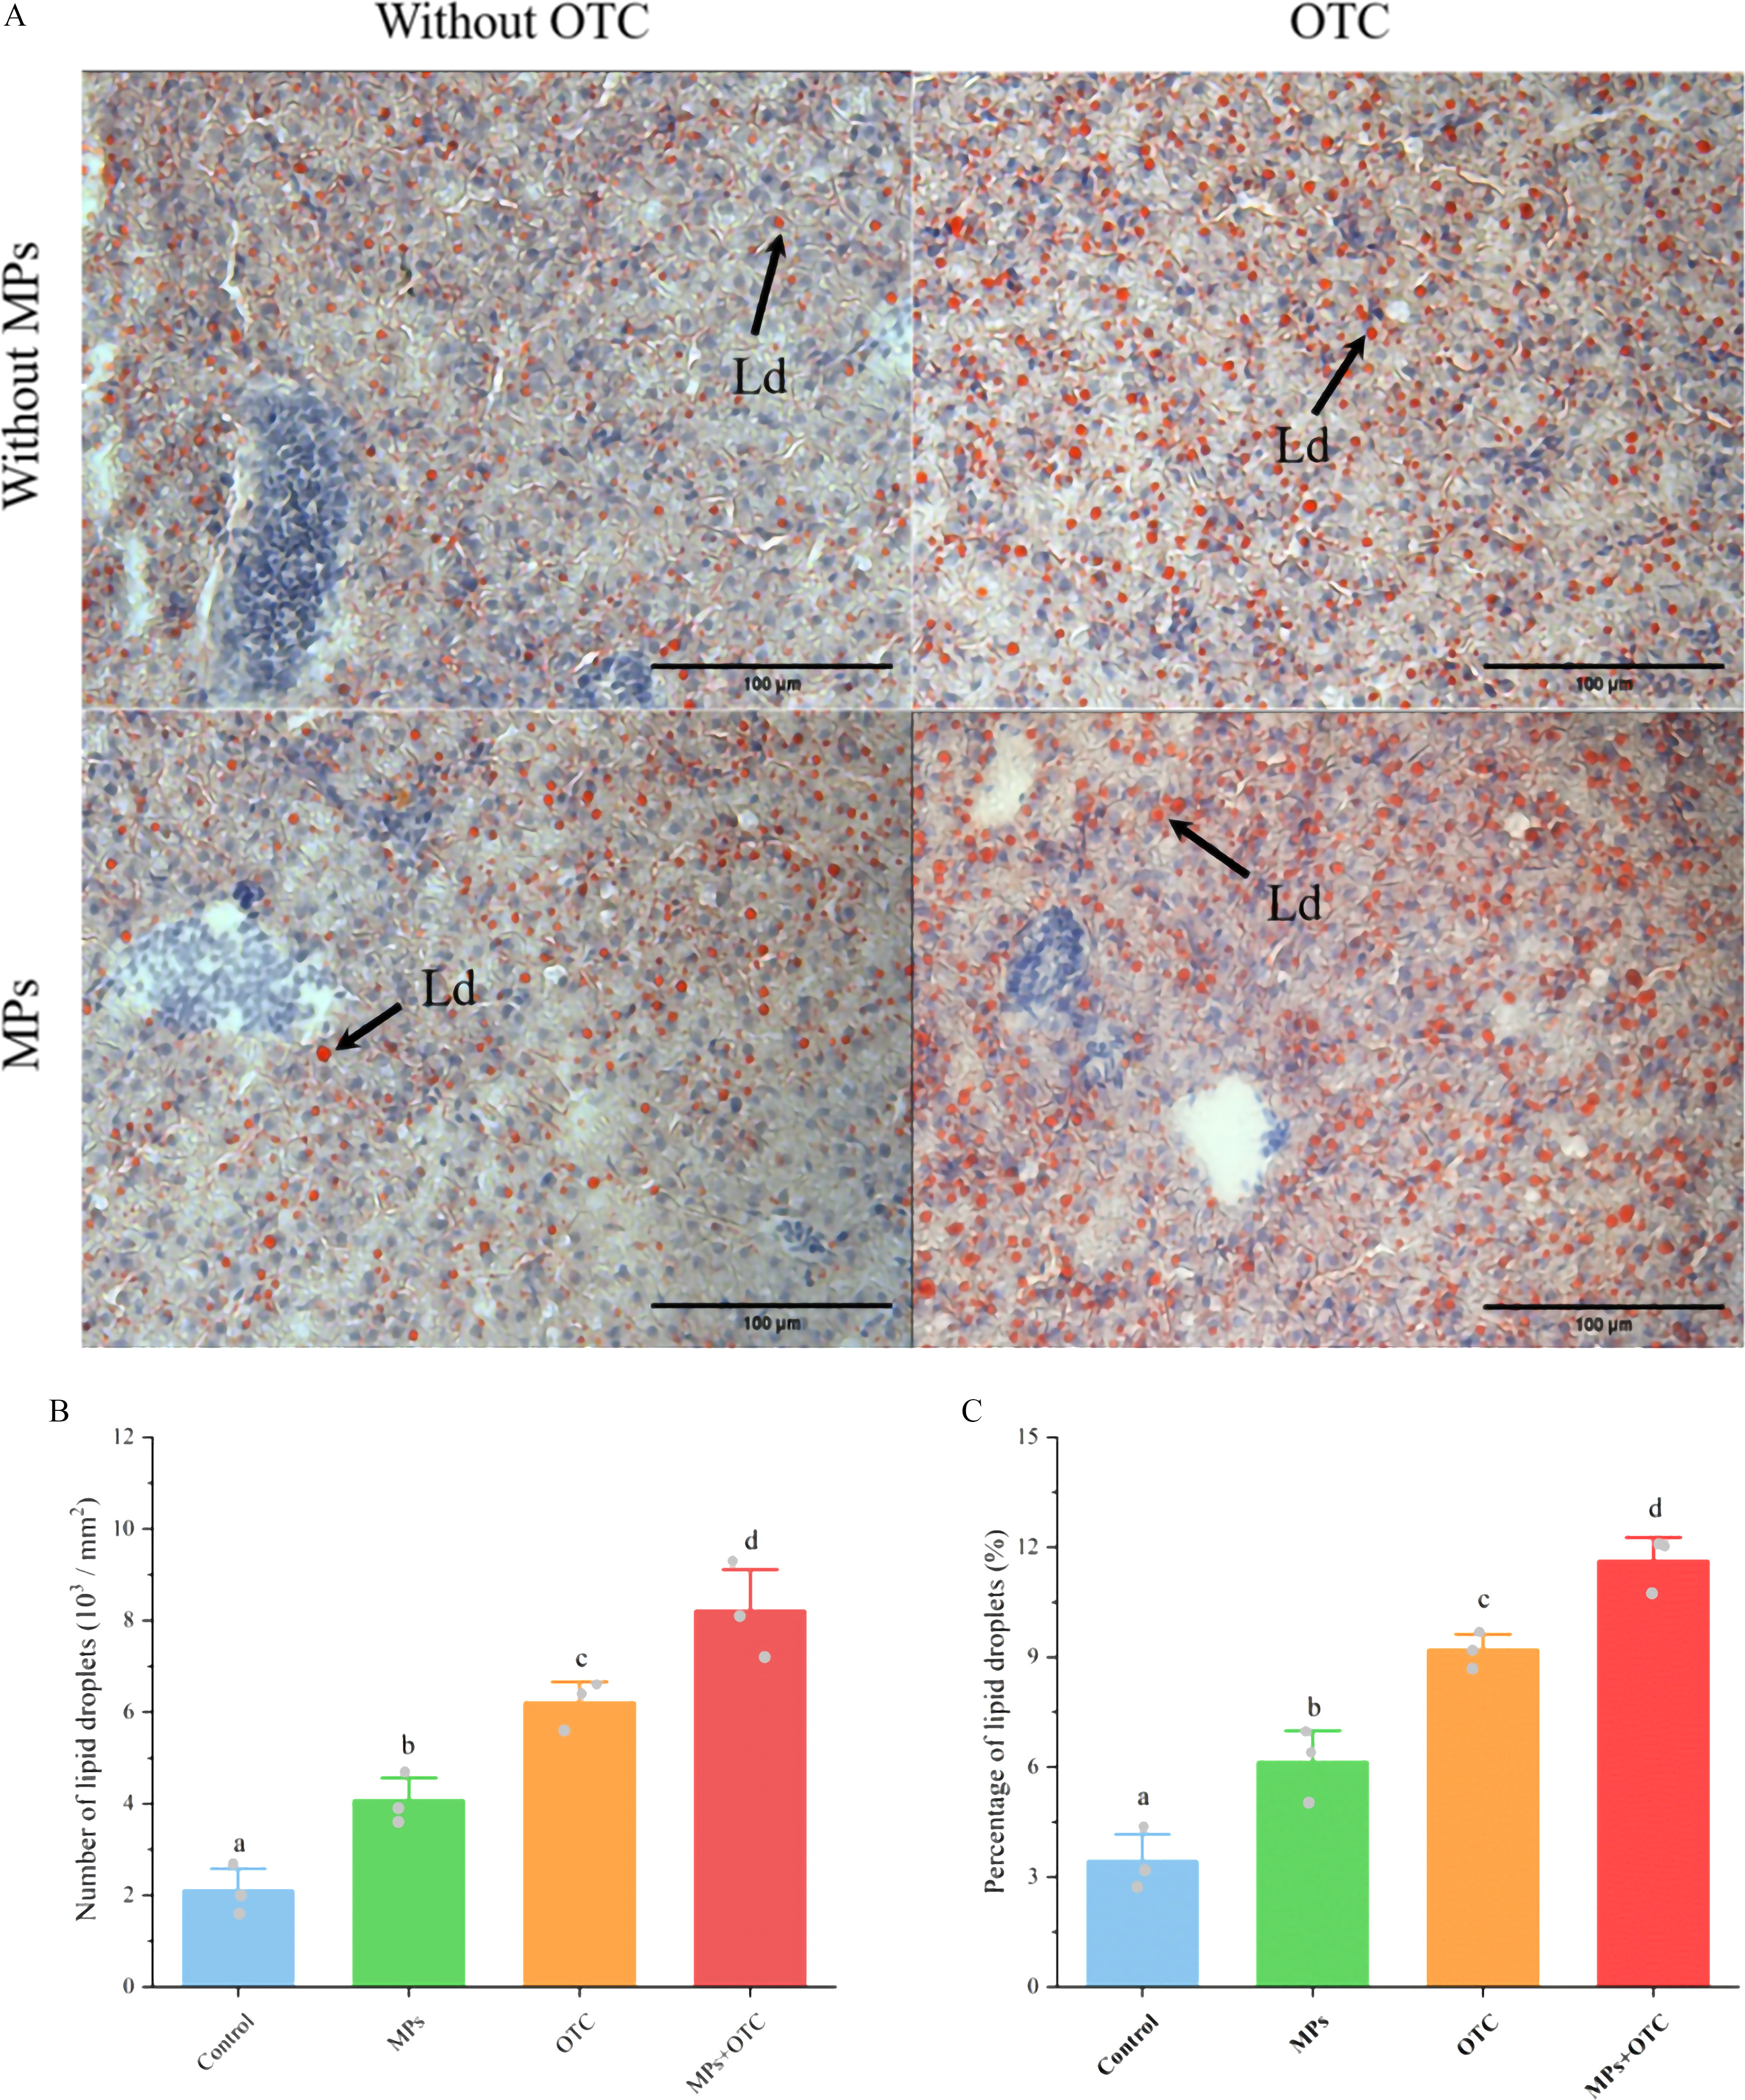
Figure 1.
(A) Lipid droplet staining using Oil Red O (n =6 and randomly selected images presented as representatives), (B) numbers of lipid droplets per millimeter squared (n = 3), and (C) quantified area of lipid droplets to that of the whole tissue observed (n = 3) in zebrafish livers after 28-d exposure to control, MPs, OTC, and MP-OTC, respectively. The black arrows in (A) indicate lipid droplets (Lds) (magnification at 200x and scale bar: 100μm). Numbers of lipid droplets were counted manually and the percentages of lipid droplet area to that of the whole tissue observed were estimated with ImageJ in (B) and (C), respectively. The corresponding numeric data of (B) and (C) are provided in Table S4. Data (means±SEs) with different superscripts above were significantly different at p<0.05 (one-way analysis of variance and Tukey’s post hoc tests). Note: MP-OTC, microplastics and oxytetracycline; MPs, microplastics; OTC, oxytetracycline; SE, standard error.