
|
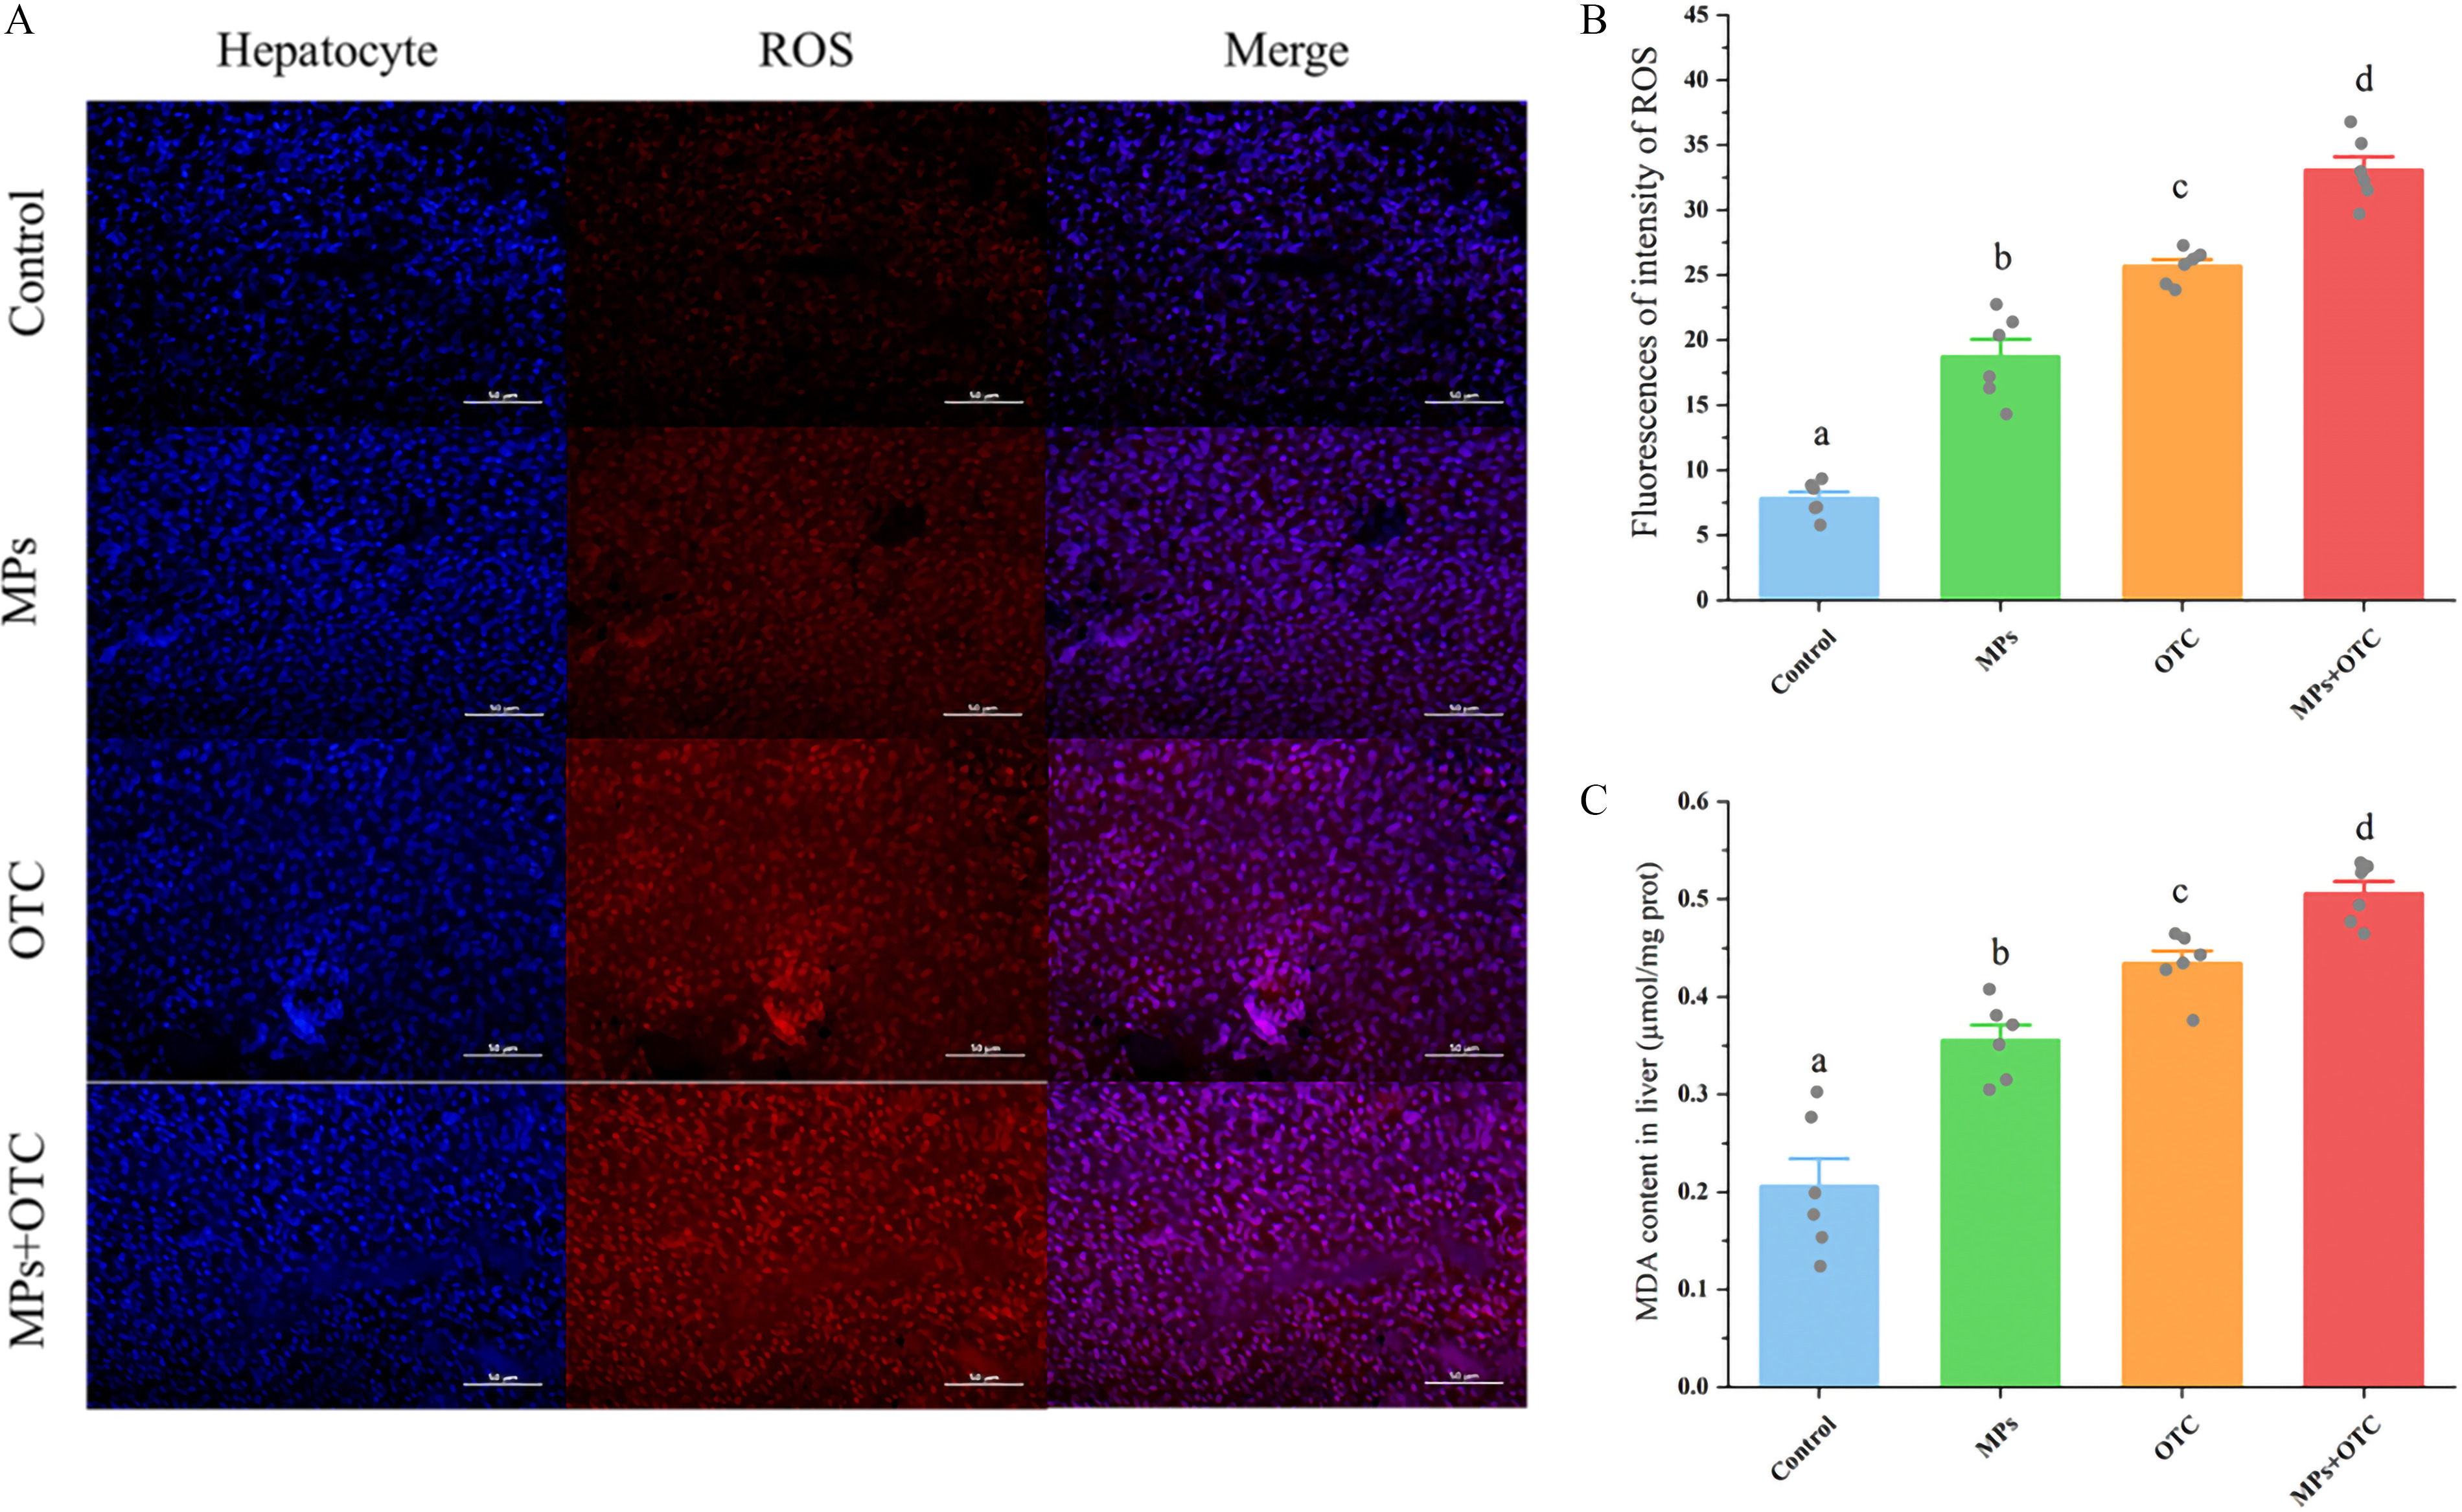
Figure 4. (A) ROS-specific fluorescent staining, (B) quantified ROS fluorescent intensities, and (C) MDA contents in zebrafish livers after 28-d exposure to control, MPs, OTC, and MP-OTC, respectively [n=6 for each experimental group, and randomly selected images are presented as representatives for (A)]. The hepatocyte and ROS were stained in blue (DAPI) and red (DHE) in (A), respectively (magnification at 400× and scale bar: 50μm). The ROS-specific fluorescence intensity was determined using ImageJ and the MDA content was measured with a commercial kit (BC0025; Solarbio) using a microplate reader (Multiskan GO; Thermo Scientific). The corresponding numeric data are provided in Table S7. Data (means±SEs) with different superscripts above in (B) and (C) were significantly different between groups at p<0.05 (one-way analysis of variance and Tukey’s post hoc tests). Note: DAPI, 4′,6-diamidino-2-phenylindole; DHE, dihydroethidium; MDA, malondialdehyde; MP-OTC, microplastics and oxytetracycline; MPs, microplastics; OTC, oxytetracycline; prot, protein; ROS, reactive oxygen species; SE, standard error.