
- Title
-
A novel small molecule, AS1, reverses the negative hedonic valence of noxious stimuli
- Authors
- Esancy, K., Conceicao, L.L., Curtright, A., Tran, T., Condon, L., Lecamp, B., Dhaka, A.
- Source
- Full text @ BMC Biol.
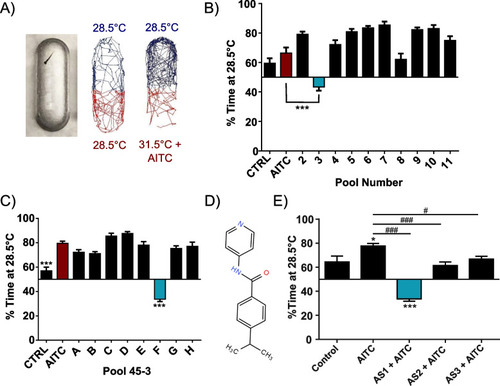
Identifying AS1, a novel compound that reverses sensitized thermal aversion, from a small molecule screen. A Left: photograph of a 5dpf zebrafish larva in a single arena of a 32-well temperature choice assay plate. Middle: representative traces/motion tracking of a zebrafish larva when both sides of the plate are set to 28.5 °C. No preference is demonstrated. Bottom: representative traces of a zebrafish larva given the choice between 28.5 and 31.5 °C after incubation in AITC. Clear preference for the 28.5 °C side is shown. B Results from screening Plate 43 in the sensitized temperature preference assay. Fish in all conditions except Pool 3 significantly favored the 28.5 °C side of the arena, whereas fish incubated in Pool 3 significantly chose the 31.5 °C side. N = 50 larvae for the control condition, N = 49 for the AITC only condition, N = 64, 52, 57, 63, 63, 61, 59, 63, 54, 58 larvae for Pools 2–11, respectively. C Demultiplexing Pool 45–3. Fish in all conditions except Pool F significantly preferred the 28.5 °C side, whereas fish in Pool F preferred the 37.5 °C side. N = 52, 63, 63, 63, 64, 58, 61, 64, 62, 57 larva for control, AITC, and groups A–H. *** denotes significant difference between the control and Pool F groups and the AITC only group. D The chemical structure of AS1 (4-propan-2-yl-N-pyridin-4-ylbenzamide). E Comparison of AS1 with two other potential novel analgesics, AS2 and AS3. N = 29, 58, 64, 49, 63 larvae for control, AITC, and AS1-3 conditions, respectively. * denotes significant difference from DMSO-treated control fish; # denotes significant difference from AITC-treated fish. */# p < 0.05, **/## p < 0.01, ***/### p < 0.001. One-way ANOVA with Dunnett’s multiple comparison tests was performed in B and C. One-way ANOVA with Tukey’s multiple comparisons test was performed in E. For all choice experiments (B, C, E), a one-sample t test was performed with a hypothetical mean of 50% to determine if fish were significantly choosing one side of the arena |
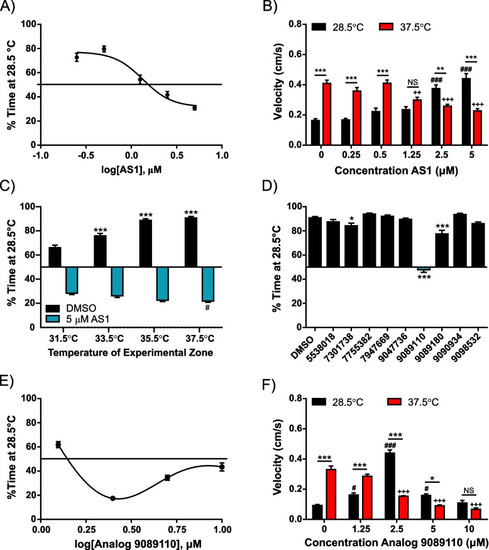
Probing the effects of AS1 using a non-sensitized thermal aversion assay. A AS1 dose–response curve in the non-sensitized thermal preference assay (28.5 vs 37.5 °C). At low concentrations, AS1 does not influence preference for 28.5 °C, whereas intermediate concentrations (1.25 μM) eliminate preference for either zone, and high concentrations (> 2.5 μM) induce preference for the 37.5 °C zone. N = 58, 58, 60, 63, 63, 62 for 0, 0.25, 0.5, 1.25, 2.5, and 5 μM AS1 conditions, respectively. B Velocity data for experiments shown in A. In control conditions (0 μM AS1), larval zebrafish locomote at much greater velocities in the 37.5 °C zone than in the 28.5 °C zone. Interestingly, as the concentration of AS1 increases, this velocity difference switches—velocity increases in the 28.5 °C portion but decreases in the 37.5 °C portion. At an intermediate concentration, there is no difference between velocities at 28.5 and 37.5 °C. * denotes significant differences in swimming velocities between the 28.5 and 37.5 °C zones for the same group of fish, + denotes significant difference from the 0 μM AS1 37.5 °C swimming velocity, and # denotes significant difference from the 0 μM AS1 28.5 °C swimming velocity. C Thermal preference assay assessing choice between rearing temperature (28.5 °C) and a range of aversive temperatures (31.5 °C, 33.5 °C, 35.5 °C, and 37.5 °C). As the intensity of the heat stimulus increases, vehicle-treated fish increasingly prefer the 28.5 °C zone, while the AS1-treated fish increasingly prefer the hot zone. All DMSO-treated fish significantly preferred the 28.5 °C, whereas all AS1-treated fish significantly preferred the 37.5 °C side, regardless of temperature comparison. N = 117 fish for DMSO and 127 for AS1 (31.5 °C), 111 for DMSO and 126 for AS1 (33.5 °C), 105 for DMSO and 125 for AS1 (35.5 °C), 73 for DMSO and 124 for AS1 (37.5 °C). * represents significant differences from 31.5 °C DMSO condition, whereas # represents significant differences from the 31.5 °C AS1 condition. D Thermal preference assay (28.5 °C vs 37.5 °C) utilizing nine different structural analogs of AS1. While two analogs slightly decreased the preference for 28.5 °C, only one of them (9089110) abolished preference for either side. N = 84, 59, 58, 46, 59, 55, 53, 32, 61, 59 fish for DMSO, 5538018, 7301738, 7755382, 7947669, 9047736, 9089110, 9089180, 9090934, and 9098532 conditions, respectively. E Analog 9089110 dose–response curve in the non-sensitized thermal preference assay (28.5 vs 37.5 °C). At low concentrations, Analog 9089110 does not influence preference for 28.5 °C, whereas higher concentrations (2.5 and 5 μM) induce preference for the 37.5 °C zone, and the highest concentration tested (10 μM) ablated choice. N = 103, 120, 119, 119, and 86 fish for 0, 1.25, 2.5, 5, and 10 μM Analog 9089110, respectively. F Velocity data for the experiments shown in E. As with AS1, in control (0 μM Analog 9089110) conditions, larval zebrafish locomote at significantly greater velocities in the 37.5 °C zone than the 28.5 °C zone. As the concentration of analog increases, zebrafish instead swim more quickly in the 28.5 °C zone and less quickly in the 37.5 °C zone, although at higher concentrations, zebrafish locomote slowly in both temperature zones, possibly due to motor impairment. */#/+ p < 0.05, **/##/++ p < 0.01, ***/###/+++ p < 0.001. A two-way ANOVA with Tukey’s multiple comparisons test was performed on the data in B, C. A one-way ANOVA with Tukey’s multiple comparisons test was performed on the data in D. A two-way ANOVA with Sidak’s multiple comparisons test was performed on the data in F. For thermal preference assays, a one-sample t test was performed with a hypothetical mean of 50% to determine if fish were significantly choosing one side of the arena over the other. Data shown in A was fit with the log(inhibitor) vs. response—Variable slope (four parameters) nonlinear fit option in GraphPad Prism, whereas the data in E was fit with the nonlinear bell-shaped dose–response curve function in GraphPad Prism |
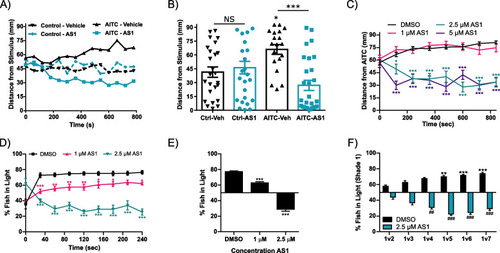
AS1 can reverse the valence of other sensory modalities. A Chemical attraction/aversion assay. When the experimental agarose is infused with 2% DMSO (dashed lines) both vehicle- and 5 μM AS1-treated fish demonstrate no preference for either end of the square chamber. When AITC (100 mM) is infused into the agarose (solid lines), the vehicle-treated fish are repelled by the agarose whereas the AS1-treated fish are attracted to the stimulus. N = 25 fish per condition. B The distance of each individual larva from the agarose at the final time point (t = 800 s) in A. In experiments with plain agarose, both AS1 and vehicle-treated fish are dispersed evenly throughout the arena. In experiments with AITC-infused agarose, vehicle-treated larval zebrafish are found significantly farther from the agarose while AS1-treated fish are clustered close to the AITC source. C AITC aversion assay assessing multiple concentrations of AS1. Fish exposed to low concentrations of AS1 (e.g., 1 μM) continue to avoid the AITC source, whereas fish exposed to a higher concentrations swim towards the AITC source. N = 83 larvae for DMSO, 42 for 1 μM, 33 for 2.5 μM, and 37 for 5 μM AS1. D Average percentage of fish on the light side of an arena in the phototaxis (light/dark preference) assay at 30-s intervals during a 4-minute trial period. Vehicle-treated fish strongly prefer (i.e., quickly swim towards) the light half of the arena, whereas fish treated with 2.5 μM AS1 quickly navigate towards the dark. N = 40 larvae per condition. E Same experiment as in D, but showing the percentage of fish found on the light side of the arena for the last 2 min of each 4-minute trial, averaged across the last four trials. While fish treated with vehicle and 1 μM AS1 significantly prefer the light side of the arena, fish treated with 2.5 μM significantly prefer the dark. F Gradient phototaxis assay in which larval zebrafish were given the choice between a bright white background (shade 1) and increasingly darker shades (shades 2–7). While all groups of DMSO-treated fish significantly prefer the light side and 2.5 μM AS1-treated fish significantly prefer the dark side, as the intensity of darkness increases, control zebrafish increasingly prefer shade 1, whereas 2.5 μM AS1-treated zebrafish increasingly prefer the contrasting dark shade. N = 72 for DMSO and 81 for AS1 (1v2), 73 for DMSO and 78 for AS1 (1v3), 80 for DMSO and 70 for AS1 (1v4), 79 for DMSO and 79 for AS1 (1v5), 79 for DMSO and 77 for AS1 (1v6), 76 for DMSO and 77 for AS1 (1v7). * represents significant difference from the DMSO 1v2 condition, whereas # represents significant difference from the AS1 1v2 condition. */# p < 0.05, **/## p < 0.01, ***/### p < 0.001. One-way ANOVA with Tukey’s multiple comparison test was performed in B, E. Two-way ANOVA with Tukey’s multiple comparisons test was performed in C, D, F. For all temperature and light/dark choice experiments, a one-sample t test was performed with a hypothetical mean of 50% to determine if fish were significantly choosing one side of the arena |
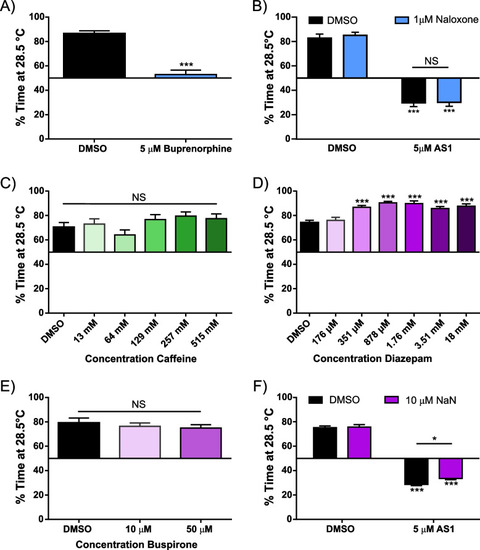
AS1 does not appear to act upon canonical valence or pain-relief circuitry. A Temperature choice assay (28.5 °C vs 37.5 °C) with buprenorphine, an opioid receptor agonist. While control fish significantly prefer the 28.5 °C zone, preference for either side is ablated in fish treated with 5 μM buprenorphine. N = 51 fish for both conditions. B Temperature choice assay (28.5 °C vs 37.5 °C) with naloxone, an opioid receptor antagonist. Naloxone does not appear to replicate or attenuate the effects of AS1; both control and naloxone only treated fish significantly choose the 28.5 °C side of the arena, whereas AS1 only and Naloxone + AS1-treated fish significantly choose the 37.5 °C side. N = 37, 56, 52, and 45 fish for DMSO, 1 μM Naloxone, 5 μM AS1, and 1 μM Naloxone + 5 μM AS1 conditions, respectively. C Temperature choice assay (28.5 °C vs 37.5 °C) with various concentrations of caffeine, an anxiogenic stimulant. At all concentrations tested, larval zebrafish significantly chose the 28.5 °C side of the arena. N = 52, 34, 51, 52, 34, and 38 fish for 0–515 mM caffeine, respectively. D Temperature choice assay (28.5 °C vs 37.5 °C) with diazepam, a GABA-modulating anxiolytic drug. At all concentrations tested, larval zebrafish significantly chose the 28.5 °C side of the arena. N = 115, 50, 53, 51, 49, 54, and 39 fish for 0–18 mM diazepam, respectively. E Temperature choice assay (28.5 °C vs 37.5 °C) with buspirone, a 5HT1A receptor agonist and anxiolytic drug. At all concentrations tested, larval zebrafish significantly preferred the 28.5 °C side of the arena. N = 27, 43, 44, fish for 0, 10, and 50 μM buspirone conditions. F Temperature choice assay (28.5 °C vs 37.5 °C) with NaN-190, a 5HT1A receptor antagonist. All AS1-treated fish significantly preferred the 37.5 °C side of the arena, while non-AS1 treated fish preferred the 28.5 °C side. N = 256 larvae for DMSO only, 132 for 10 μM NaN-190, 231 for 5 μM AS1, and 230 for 10 μM NaN-190 + 5 μM AS1. * p < 0.05, ** p < 0.01, *** p < 0.001. Two-tailed unpaired t test used in A. Two-way ANOVA with Tukey’s multiple comparisons test used in B, F. One-way ANOVA with Tukey’s multiple comparisons test used in C-E. For all temperature choice experiments, a one-sample t test was performed with a hypothetical mean of 50% to determine if fish were significantly choosing one side of the arena |
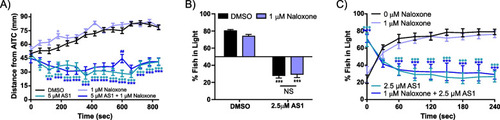
The opioid receptor antagonist naloxone does not replicate or reverse AS1-mediated attraction to noxious stimuli. A AITC aversion assay. Naloxone alone does not affect AITC avoidance, and when co-applied with AS1 this drug does not reverse AS1-induced attraction towards AITC. N = 80 fish for the DMSO condition, 71 for 5 μM AS1, 80 for 1 μM Naloxone, and 70 for 1 μM Naloxone + 5 μM AS1. * indicate significant difference from the DMSO control at each time point. B Phototaxis assay. All non-AS1-treated fish significantly chose the light side of the arena, whereas all AS1-treated fish significantly preferred the dark, regardless of whether 1 μM naloxone was applied. N = 39 fish for the DMSO condition, 41 fish for the 2.5 μM AS1 condition, 41 fish for 1 μM naloxone, and 39 fish for 1 μM naloxone + 2.5 μM AS1. C The percentage of fish in the light at 30-s intervals in the 4-min trials of the phototaxis assay shown in B, averaged across the five trials. * indicate significant difference from the DMSO (0 μM Naloxone) control at each time point. As shown, AS1-treated fish quickly migrate to the dark half of the arena at the onset of each trial, whereas fish that did not receive AS1 migrate to the light half of the arena, regardless of whether naloxone has been applied. * p < 0.05, ** p < 0.01, *** p < 0.001. Two-way ANOVA with Tukey’s multiple comparisons test used in A–C. To determine if fish were significantly choosing one side of the arena over the other a one-sample t test was performed with a hypothetical mean of 50% |
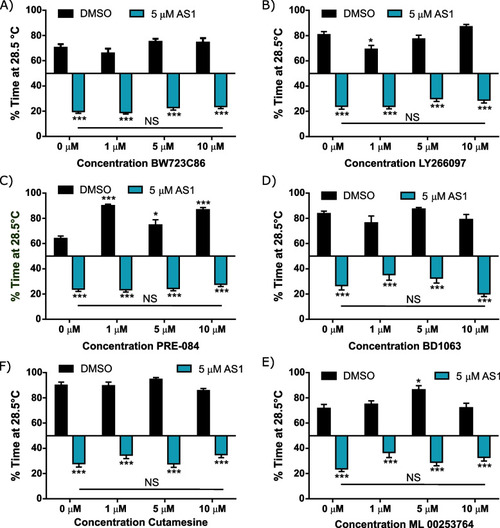
The 5HT2B, sigma-1, and melanocortin-4 receptors do not appear to mediate the effects of AS1. A Thermal preference assay (28.5 °C vs 37.5 °C) with the 5HT2B agonist BW723C86. All AS1-treated fish significantly prefer the 37.5 °C half of the arena, regardless of whether BW723C86 was co-applied. All conditions that did not receive AS1 significantly chose the 28.5 °C side. At no concentration did BW723C86 influence AS1-induced attraction towards noxious heat. N = 46 fish for vehicle-treated controls, 43 for 1 μM BW723C86, 53 for 5 μM BW723C86, 53 for 10 μM BW723C86, 56 for 5 μM AS1, 50 for 1 μM BW723C86 + 5 μM AS1, 52 for 5 μM BW723C86 + 5 μM AS1, and 59 for 10 μM BW723C86 + 5 μM AS1. B Thermal preference assay (28.5 °C vs 37.5 °C) with the 5HT2B antagonist LY266097. All AS1-treated fish significantly prefer the 37.5 °C half of the arena, regardless of whether LY266097 was co-applied. All conditions that did not receive AS1 significantly chose the 28.5 °C side. At no concentration did LY266097 influence AS1-induced attraction towards noxious heat. N = 58 larvae for the DMSO condition, 57 for 1 μM LY266097, 50 for 5 μM LY266097, 50 for 10 μM LY266097, 59 for 5 μM AS1, 61 for 1 μM LY266097 + 5 μM AS1, 59 for the 5 μM LY266097 + 5 μM AS1, and 56 for the 10 μM LY266097 + 5 μM AS1. C Thermal preference assay (28.5 °C vs 37.5 °C) with the Sigma-1 receptor agonist PRE-084. All AS1-treated fish significantly prefer the 37.5 °C half of the arena, regardless of whether PRE-084 was co-applied. All conditions that did not receive AS1 significantly chose the 28.5 °C side. At no concentration did PRE-084 influence AS1-induced attraction towards noxious heat, despite potentiating preference for the 28.5 °C zone. N = 90 fish for the DMSO condition, 27 for 1 μM PRE-084, 31 for 5 μM PRE-084, 25 for 10 μM PRE-084, 37 for 5 μM AS1, 40 for 1 μM PRE-084 + 5 μM AS1, 43 for 5 μM PRE-084 + 5 μM AS1, and 46 for 10 μM PRE-084 + 5 μM AS1. D Thermal preference assay (28.5 °C vs 37.5 °C) with the Sigma-1 receptor antagonist BD1063. All AS1-treated fish significantly prefer the 37.5 °C half of the arena, regardless of whether BD1063 was co-applied. All conditions that did not receive AS1 significantly chose the 28.5 °C side. At no concentration did BD1063 influence AS1-induced attraction towards noxious heat. N = 30 for the DMSO condition, 26 for 1 μM BD1063, 30 for 5 μM BD1063, 28 for 10 μM BD1063, 27 for 5 μM AS1, 30 for 1 μM BD1063 + 5 μM AS1, 29 for 5 μM BD1063 + 5 μM AS1, and 28 for 10 μM BD1063 + 5 μM AS1. E Thermal preference assay (28.5 °C vs 37.5 °C) with the sigma-1 receptor agonist cutamesine (SA 4503). All AS1-treated fish significantly preferred the 37.5 °C half of the arena, regardless of whether cutamesine was co-applied. All conditions that did not receive AS1 significantly chose the 28.5 °C side. At no concentration did cutamesine have any effect upon temperature preference when applied alone, nor did it significantly reduce AS1-induced attraction to noxious heat. N = 30 fish for the DMSO condition, 29 for 1 μM cutamesine, 25 for 5 μM cutamesine, 54 for 10 μM cutamesine, 52 for 5 μM AS1, 49 for 1 μM cutamesine + 5 μM AS1, 52 for 5 μM + 5 μM AS1, and 58 for 10 μM cutamesine + 5 μM AS1. F Thermal preference assay (28.5 °C vs 37.5 °C) with the melanocortin 4 receptor antagonist ML00253764. All AS1-treated fish significantly prefer the 37.5 °C half of the arena, regardless of whether ML00253764 was co-applied. All conditions that did not receive AS1 significantly chose the 28.5 °C side. At no concentration did ML00253764 reduce AS1-induced attraction towards noxious heat, even though one concentration (5 μM) did slightly potentiate preference towards the 28.5 °C zone. N = 30 fish for the DMSO condition, 31 for 1 μM ML00253764, 28 for 5 μM ML00253764, 31 for 10 μM ML00253764, 31 for 5 μM AS1, 32 for 1 μM ML00253764 + 5 μM AS1, 32 for 5 μM ML00253764 + 5 μM AS1, and 31 for 10 μM ML00253764 + 5 μM AS1. * p < 0.05, ** p < 0.01, *** p < 0.001. Two-way ANOVA with Sidak’s multiple comparisons test used for A; two-way ANOVA with Tukey’s multiple comparisons test used for B–F. To determine if fish were significantly choosing one side of the arena over the other, a one-sample t test was performed with a hypothetical mean of 50% |
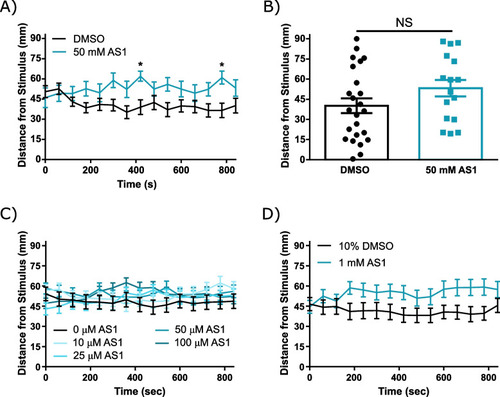
AS1 is not inherently attractive. A A chemical attraction/aversion assay in which either vehicle (2% DMSO) or 50 mM AS1 was infused into agarose lining one side of a square petri dish. As shown, larval zebrafish are not drawn towards the AS1 source. N = 27 larvae in the DMSO group, 16 in the AS1 group. B Distance of each individual larva from the AITC stimulus at the final time point (840 s) for the experiment shown in A. C Chemical attraction/aversion assay in which 2 mL of 1% DMSO or variable concentrations of AS1 (in 1% DMSO vehicle). Larval zebrafish do not appear to swim towards the AS1 source at any concentration tested for the duration of the assay. N = 36 fish for the DMSO condition, 36 for the 10 μM AS1 condition, 36 for the 25 μM AS1 condition, 40 for the 50 μM AS1 condition, and 40 for the 100 μM AS1 condition. D Same as C, but with 10% DMSO or 1 mM AS1 (in 10% DMSO). N = 36 larvae in both conditions. * p < 0.05, ** p < 0.01, *** p < 0.001. Two-tailed unpaired t test used in B. Two-way ANOVA with Sidak’s multiple comparisons test used in A, D. Two-way ANOVA with Tukey’s multiple comparisons test used in C |
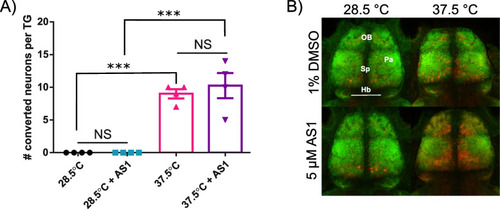
AS1 engages central nervous system circuitry in the presence of noxious stimuli. A Number of photoconverted trigeminal neurons in control or AS1-treated zebrafish exposed to either 28.5 or 37.5 °C. N = 4 larvae per condition. B Representative images of the telencephalon of 6dpf larval zebrafish exposed to 1% DMSO or 5 μM AS1, + / − noxious heat (37.5 °C) for 15 min and subsequently stained for pERK (red) and tERK (green). Images are cropped from maximum intensity projections (~ 35 μm) of confocal z-stacks taken of whole brains. N = 12 fish for DMSO + 28.5 °C, 10 fish for 5 μM AS1 + 28.5 °C, 14 fish for DMSO + 37.5 °C, and 19 fish for 5 μM AS1 + 37.5 °C. OB = olfactory bulb, Sp = subpallium, Pa = pallium, Hb = habenula. * p < 0.05, ** p < 0.01, *** p < 0.001. One-way ANOVA with Tukey’s multiple comparisons test used in A |
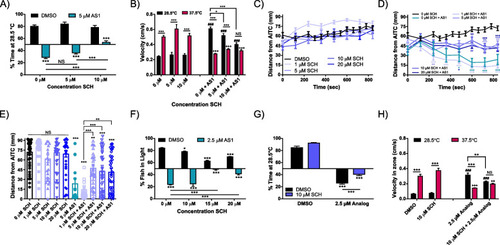
The D1 receptor antagonist SCH23390 partially reverses AS1-induced attraction to noxious stimuli. A Temperature choice assay (28.5 °C vs 37.5 °C) with SCH23390. Control fish and those treated with 5 or 10 μM SCH significantly preferred the 28.5 °C side of the arena, whereas fish treated with 5 μM AS1 alone or 5 μM SCH + 5 μM AS1 significantly preferred the 37.5 °C side. Interestingly, fish treated with 10 μM SCH + 5 μM AS1 exhibited no preference between the two sides of the arena, indicating an abolition of choice following D1 receptor blockade. N = 74 fish for the DMSO condition, 58 fish for 5 μM SCH, 43 fish for 10 μM SCH, 81 fish for 5 μM AS1, 52 fish for 5 μM SCH + 5 μM AS1, and 50 for 10 μM SCH + 5 μM AS1. B Velocity data for the experiment in A. While AS1 treatment still significantly reduces swimming velocity at 37.5 °C and increases velocity at 28.5 °C, treatment with progressively higher concentrations of SCH does significantly reduce this AS1-induced heightened velocity at 28.5 °C, and at 10 μM SCH (+ 5 μM AS1), there is no longer a significant difference in swimming velocity between the 28.5 and 37.5 °C zones. * denotes significant differences in swimming velocities between the 28.5 and 37.5 °C zones for the same group of fish, + denotes significant difference from the 0 μM AS1 37.5 °C swimming velocity, and # denotes significant difference from the 0 μM AS1 28.5 °C swimming velocity. C, D AITC aversion assay. SCH alone does not elicit changes in AITC avoidance, whereas concentrations of SCH 5 μM and above partially attenuate AS1-induced attraction to AITC. N = 44 fish for DMSO, 38 for 1 μM SCH, 34 for 5 μM SCH, 39 for 10 μM SCH, 37 for 20 μM SCH, 14 for 5 μM AS1, 43 for 1 μM SCH + 5 μM AS1, 33 for 5 μM SCH + 5 μM AS1, 41 for 10 μM SCH + 5 μM AS1, 41 for 20 μM SCH + 5 μM AS1. * represent the significant difference of experimental traces from the DMSO-treated control fish at each indicated time point. E Distance of each individual larva from the AITC stimulus at the final time point (840 s) for the experiment shown in C, D. * presented directly over columns represent the significant difference between the DMSO-only control condition, and between other columns when indicated by lines. F Phototaxis assay. While SCH alone does cause a significant decrease in the percentage of fish found in the light half of the arena when applied at higher concentrations, fish in these conditions still significantly prefer the light half of the arena. When co-applied with AS1, 15 μM and 20 μM SCH are able to significantly reduce AS1-induced preference for the dark, with 15 μM SCH abolishing preference entirely. N = 80 fish for DMSO, 80 for 10 μM SCH, 40 for 15 μM SCH, 80 for 20 μM SCH, 80 for 2.5 μM AS1, 40 for 10 μM SCH + 2.5 μM AS1, 40 for 15 μM SCH + 2.5 μM AS1, and 40 for 20 μM SCH + 2.5 μM AS1. G Temperature choice assay (28.5 °C vs 37.5 °C) with fish treated with 2.5 μM Analog 9089110 and/or 10 μM SCH23390. Control fish and those treated with 10 μM SCH significantly preferred the 28.5 °C side of the arena, whereas analog-treated fish significantly preferred the 37.5 °C side. As with AS1, treatment with 10 μM SCH23390 significantly attenuated analog-induced attraction to noxious heat, although these fish still preferred noxious heat over rearing temperature. N = 48 fish for the DMSO condition, 42 fish for 10 μM SCH, 55 fish for 2.5 μM Analog 9089110, and 60 fish for 2.5 μM Analog 9089110 + 10 μM SCH. H Velocity data for the experiment shown in G. * denotes significant differences in swimming velocities between the 28.5 and 37.5 °C zones for the same group of fish, + denotes significant difference from the 0 μM Analog 37.5 °C swimming velocity, and # denotes significant difference from the 0 μM Analog 28.5 °C swimming velocity. Similar to our AS1 experiments, treatment with 10 μM SCH was able to partially reverse the Analog-induced inversion of swimming velocity, at least in the 28.5 °C zone. */#/+ p < 0.05, **/##/++ p < 0.01, ***/###/+++ p < 0.001. Two-way ANOVA with Tukey’s multiple comparisons test used in A–D, F–H. One-way ANOVA with Tukey’s multiple comparisons test used in E. For all temperature and light/dark choice experiments, a one-sample t test was performed with a hypothetical mean of 50% to determine if fish were significantly choosing one side of the arena over the other |

The D1 receptor agonist SKF82958 partially reverses AS1-induced attraction to noxious stimuli. A Temperature choice assay (28.5 °C vs 37.5 °C) with various concentrations of SKF82958. DMSO or SKF alone treated fish demonstrated significant preference for the 28.5 °C side of the arena, with the highest concentration of SKF tested eliciting a slight potentiation of preference for the 28.5 °C side. While all AS1-treated fish still preferred the 37.5 °C side of the arena regardless of whether SKF was also present, application of both 10 and 30 μM SKF did induce a significant decrease in the proportion of time fish spent in the 37.5 °C half of the arena. N = 53 fish for the DMSO condition, 53 for 10 μM SKF, 54 for 30 μM SKF, 61 for 5 μM AS1, 60 for 10 μM SKF + 5 μM AS1, and 60 for 30 μM SKF + 5 μM AS1. B Swimming velocity from the experiment shown in A. While AS1 treatment still reverses velocity patterns observed in the 37.5 and 28.5 °C zones, co-incubation with SKF partially attenuates this effect. At 10 μM SKF, the difference between swimming velocity in both zones is insignificant, and the swimming velocity at 28.5 °C is no different than that of vehicle-treated control fish. * denotes significant differences in swimming velocities between the 28.5 and 37.5 °C zones for the same group of fish, + denotes significant difference from the 0 μM AS1 37.5 °C swimming velocity, and # denotes significant difference from the 0 μM AS1 28.5 °C swimming velocity. C, D AITC aversion assay. SKF alone does not elicit any large changes in avoidance of the noxious AITC stimulus, but does partially reverse AS1-induced attraction towards AITC. N = 40 fish for the DMSO condition, 40 for the 10 μM SKF, 40 for the 30 μM SKF, 38 for 2.5 μM AS1, 36 for 10 μM SKF + 2.5 μM AS1, and 39 for 30 μM SKF + 2.5 μM AS1. * represent the significant difference of experimental traces from the DMSO-treated control fish at each indicated time point. # represent the significant difference of experimental traces compared to AS1-only control fish at the indicated time points. E Distance of each individual larva from the AITC source at the final time point (840 s) for the experiment shown in C, D. While AS1-treated fish cluster near the AITC source, fish co-incubated in SKF exhibit greater dispersal across the arena by the end of the experiment. * presented directly over columns represent the significant difference between the DMSO-only control condition, and between other columns when indicated by lines. F Phototaxis assay. While 10 μM SKF did elicit a slight decrease in the proportion of fish found in the light by itself, these fish still significantly preferred the light side, as did the vehicle-treated fish. AS1-only treated fish significantly preferred the dark half of the arena, but concurrent treatment with 10 μM SKF restored preference for the light side. N = 40 for all conditions. */#/+ p < 0.05, **/##/++ p < 0.01, ***/###/+++ p < 0.001. Two-way ANOVA with Tukey’s multiple comparisons test used in A–D, F. One-way ANOVA with Tukey’s multiple comparisons test used in E. For all temperature and light/dark choice experiments, a one-sample t test was performed with a hypothetical mean of 50% to determine if fish were significantly choosing one side of the arena over the other |
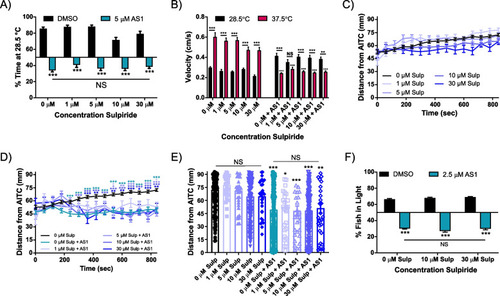
The D2 receptor antagonist sulpiride does not replicate or reverse the effects of AS1 in multiple choice assays. A Temperature choice assay (28.5 °C vs 37.5 °C) with various concentrations of sulpiride. All AS1-treated fish significantly preferred the 37.5 °C side, whereas fish treated only with sulpiride or vehicle solution significantly chose the 28.5 °C side. N = 28 larvae for 1% DMSO, 37 for 1 μM sulpiride, 41 for 5 μM sulpiride, 44 for 10 μM sulpiride, 30 for 30 μM sulpiride, 58 for 5 μM AS1, 49 for 1 μM sulpiride + 5 μM AS1, 52 for 5 μM sulpiride + 5 μM AS1, 54 for 10 μM sulpiride + 5 μM AS1, and 62 for 30 μM sulpiride + 5 μM AS1. B Swimming velocity of the fish in the experiment shown in A. AS1-treated fish have significantly lower velocities at 37.5 °C than at 28.5 °C at all concentrations of sulpiride tested apart from 1 μM. Additionally, AS1-treated fish have significantly lower swimming velocities at 37.5 °C than non-AS1 treated fish at all concentrations of sulpiride tested. * denotes significant differences in swimming velocities between the 28.5 and 37.5 °C zones for the same group of fish, + denotes significant difference from the 0 μM AS1 37.5 °C swimming velocity, and # denotes significant difference from the 0 μM AS1 28.5 °C swimming velocity. C AITC aversion assay with various concentrations of sulpiride. None of the sulpiride concentrations tested elicited a change in AITC aversion. N = 174 fish for DMSO, 36 fish for 1 μM sulpiride, 34 fish for 5 μM sulpiride, 177 fish for 10 μM sulpiride, and 33 fish for 30 μM sulpiride. D AITC aversion assay for various concentrations of sulpiride + 5 μM AS1, with DMSO control fish shown in C. At no concentration tested does sulpiride attenuate AS1-induced attraction to AITC. N = 169 fish for 5 μM AS1, 32 fish for 1 μM sulpiride + 5 μM AS1, 32 fish for 5 μM sulpiride + 5 μM AS1, 172 fish for 10 μM sulpiride + 5 μM AS1, and 33 fish for 30 μM sulpiride + 5 μM AS1. * represent the significant difference of experimental traces from the DMSO-treated control fish at each indicated time point. E The distance of each individual larva from the AITC-infused agarose at the final time point (t = 840 s) of the experiment shown in C and D. Whereas control and all sulpiride-only condition fish localize farther from the AITC source, all AS1-treated fish congregate closer to the AITC source. * presented directly over columns represent the significant difference between the DMSO-only control condition, and between other columns when indicated by lines. F Light/dark preference assay. No tested concentration of sulpiride was capable of reversing AS1-induced preference for the dark. N = 39 fish for 0 μM sulpiride, 40 for 10 μM sulpiride, 40 for 30 μM sulpiride, 77 for 0 μM sulpiride + 5 μM AS1, 79 for 10 μM sulpiride + 5 μM AS1, and 83 for 30 μM sulpiride + 5 μM AS1. */#/+ p < 0.05, **/##/++ p < 0.01, ***/###/+++ p < 0.001. Two-way ANOVA with Tukey’s multiple comparisons test used in A–D, F. One-way ANOVA with Tukey’s multiple comparisons test used in E. For all temperature and light/dark choice experiments, a one-sample t test was performed with a hypothetical mean of 50% to determine if fish were significantly choosing one side of the arena |
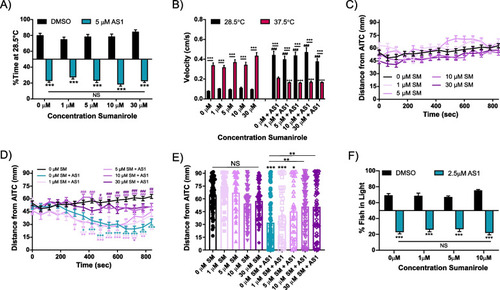
The D2 receptor agonist sumanirole maleate does not replicate or reverse the effects of AS1 in multiple assays. A Temperature choice assay (28.5 °C vs 37.5 °C) with various concentrations of sumanirole. All AS1-treated fish significantly preferred the 37.5 °C side regardless of sumanirole concentration, whereas fish treated only with sumanirole or vehicle solution significantly chose the 28.5 °C side. N = 44 fish for DMSO, 41 for 1 μM sumanirole, 59 for 5 μM sumanirole, 44 for 10 μM sumanirole, 48 for 30 μM sumanirole, 28 for 5 μM AS1, 46 for 1 μM sumanirole + 5 μM AS1, 50 for 5 μM sumanirole + 5 μM AS1, 37 for 10 μM sumanirole + 5 μM AS1, and 53 for 30 μM sumanirole + 5 μM AS1. B Velocity data for fish in the experiment shown in A. AS1 treatment significantly increases swimming velocity in the 28.5 °C zone and decreases swimming velocity in the 37.5 °C zone, regardless of the concentration of sumanirole co-applied to the zebrafish. Sumanirole alone has no effect upon swimming velocity in either zone. * denotes significant differences in swimming velocities between the 28.5 and 37.5 °C zones for the same group of fish, + denotes significant difference from the 0 μM AS1 37.5 °C swimming velocity, and # denotes significant difference from the 0 μM AS1 28.5 °C swimming velocity. C, D AITC aversion assay. Sumanirole alone does not affect aversion to this noxious chemical stimulus, but at higher concentrations partially attenuates AS1-induced attraction to AITC. N = 68 for 0 μM sumanirole, 36 for 1 μM sumanirole, 36 for 5 μM sumanirole, 61 for 10 μM sumanirole, 63 for 30 μM sumanirole, 64 for 0 μM sumanirole + 2.5 μM AS1, 34 for 1 μM sumanirole + 2.5 μM AS1, 34 for 5 μM sumanirole + 2.5 μM AS1, 61 for 10 μM sumanirole + 2.5 μM AS1, and 63 for 30 μM sumanirole + 2.5 μM AS1. * represent the significant difference of experimental traces from the DMSO-treated control fish at each indicated time point. # represent the significant difference of experimental traces compared to AS1-only control fish at the indicated time points. E Distance of each individual larva from the AITC stimulus at the final time point (840 s) from the experiment shown in C, D. * presented directly over columns represent the significant difference between the DMSO-only control condition, and between other columns when indicated by lines. F Phototaxis assay. AS1-treated fish significantly chose the dark half of the arena regardless of what concentration of sumanirole was co-applied, whereas vehicle and sumanirole-only treated fish significantly chose the light half of the arena. N = 23 fish for 0 μM sumanirole, 37 for 1 μM sumanirole, 41 for 5 μM sumanirole, 40 for 10 μM sumanirole, 40 for 0 μM sumanirole + 2.5 μM AS1, 46 for 1 μM sumanirole + 2.5 μM AS1, 43 for 5 μM sumanirole + 2.5 μM AS1, and 40 for 10 μM sumanirole + 2.5 μM AS1. */#/+ p < 0.05, **/##/++ p < 0.01, ***/###/+++ p < 0.001. Two-way ANOVA with Sidak’s multiple comparisons test used in A, B. Two-way ANOVA with Tukey’s multiple comparisons test used in C, D, F. One-way ANOVA with Tukey’s multiple comparisons test used in E. For all temperature and light/dark choice experiments, a one-sample t test was performed with a hypothetical mean of 50% to determine if fish were significantly choosing one side of the arena over the other |