
|
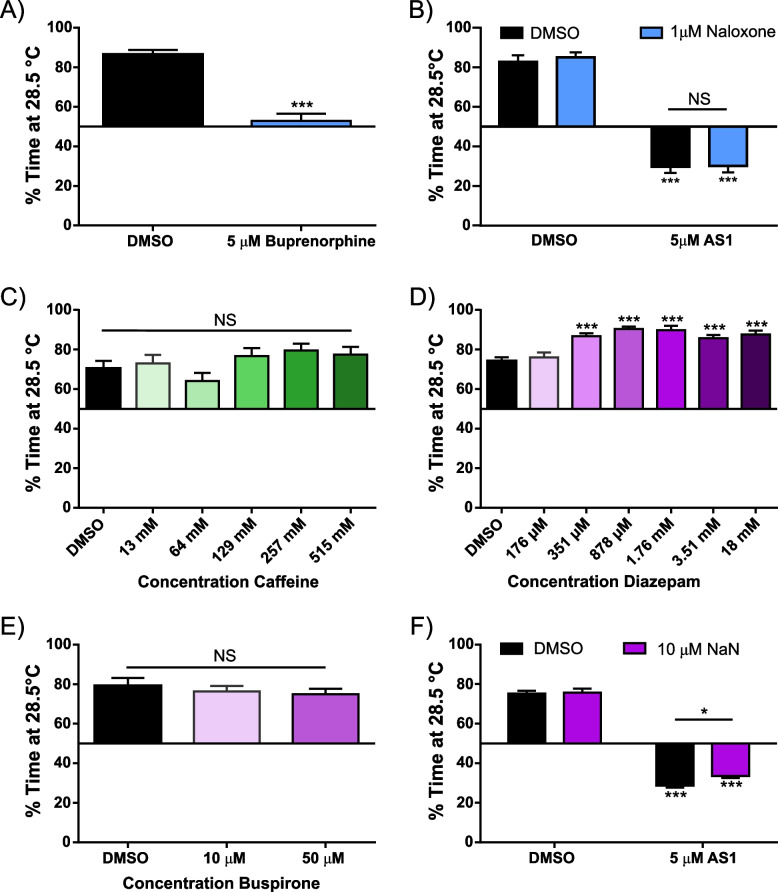
Fig. 4
AS1 does not appear to act upon canonical valence or pain-relief circuitry. A Temperature choice assay (28.5 °C vs 37.5 °C) with buprenorphine, an opioid receptor agonist. While control fish significantly prefer the 28.5 °C zone, preference for either side is ablated in fish treated with 5 μM buprenorphine. N = 51 fish for both conditions. B Temperature choice assay (28.5 °C vs 37.5 °C) with naloxone, an opioid receptor antagonist. Naloxone does not appear to replicate or attenuate the effects of AS1; both control and naloxone only treated fish significantly choose the 28.5 °C side of the arena, whereas AS1 only and Naloxone + AS1-treated fish significantly choose the 37.5 °C side. N = 37, 56, 52, and 45 fish for DMSO, 1 μM Naloxone, 5 μM AS1, and 1 μM Naloxone + 5 μM AS1 conditions, respectively. C Temperature choice assay (28.5 °C vs 37.5 °C) with various concentrations of caffeine, an anxiogenic stimulant. At all concentrations tested, larval zebrafish significantly chose the 28.5 °C side of the arena. N = 52, 34, 51, 52, 34, and 38 fish for 0–515 mM caffeine, respectively. D Temperature choice assay (28.5 °C vs 37.5 °C) with diazepam, a GABA-modulating anxiolytic drug. At all concentrations tested, larval zebrafish significantly chose the 28.5 °C side of the arena. N = 115, 50, 53, 51, 49, 54, and 39 fish for 0–18 mM diazepam, respectively. E Temperature choice assay (28.5 °C vs 37.5 °C) with buspirone, a 5HT1A receptor agonist and anxiolytic drug. At all concentrations tested, larval zebrafish significantly preferred the 28.5 °C side of the arena. N = 27, 43, 44, fish for 0, 10, and 50 μM buspirone conditions. F Temperature choice assay (28.5 °C vs 37.5 °C) with NaN-190, a 5HT1A receptor antagonist. All AS1-treated fish significantly preferred the 37.5 °C side of the arena, while non-AS1 treated fish preferred the 28.5 °C side. N = 256 larvae for DMSO only, 132 for 10 μM NaN-190, 231 for 5 μM AS1, and 230 for 10 μM NaN-190 + 5 μM AS1. * p < 0.05, ** p < 0.01, *** p < 0.001. Two-tailed unpaired t test used in A. Two-way ANOVA with Tukey’s multiple comparisons test used in B, F. One-way ANOVA with Tukey’s multiple comparisons test used in C-E. For all temperature choice experiments, a one-sample t test was performed with a hypothetical mean of 50% to determine if fish were significantly choosing one side of the arena