
Fig. 2
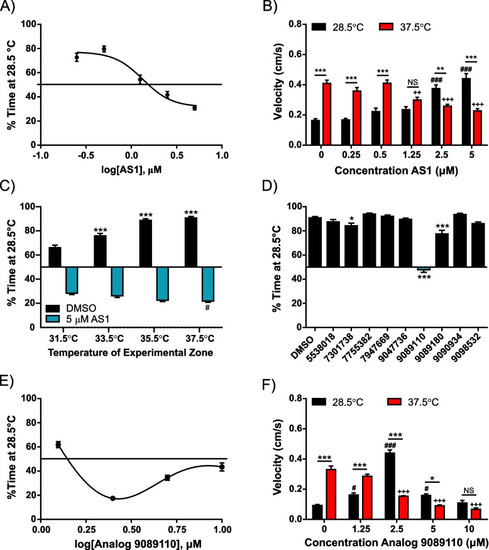
Probing the effects of AS1 using a non-sensitized thermal aversion assay. A AS1 dose–response curve in the non-sensitized thermal preference assay (28.5 vs 37.5 °C). At low concentrations, AS1 does not influence preference for 28.5 °C, whereas intermediate concentrations (1.25 μM) eliminate preference for either zone, and high concentrations (> 2.5 μM) induce preference for the 37.5 °C zone. N = 58, 58, 60, 63, 63, 62 for 0, 0.25, 0.5, 1.25, 2.5, and 5 μM AS1 conditions, respectively. B Velocity data for experiments shown in A. In control conditions (0 μM AS1), larval zebrafish locomote at much greater velocities in the 37.5 °C zone than in the 28.5 °C zone. Interestingly, as the concentration of AS1 increases, this velocity difference switches—velocity increases in the 28.5 °C portion but decreases in the 37.5 °C portion. At an intermediate concentration, there is no difference between velocities at 28.5 and 37.5 °C. * denotes significant differences in swimming velocities between the 28.5 and 37.5 °C zones for the same group of fish, + denotes significant difference from the 0 μM AS1 37.5 °C swimming velocity, and # denotes significant difference from the 0 μM AS1 28.5 °C swimming velocity. C Thermal preference assay assessing choice between rearing temperature (28.5 °C) and a range of aversive temperatures (31.5 °C, 33.5 °C, 35.5 °C, and 37.5 °C). As the intensity of the heat stimulus increases, vehicle-treated fish increasingly prefer the 28.5 °C zone, while the AS1-treated fish increasingly prefer the hot zone. All DMSO-treated fish significantly preferred the 28.5 °C, whereas all AS1-treated fish significantly preferred the 37.5 °C side, regardless of temperature comparison. N = 117 fish for DMSO and 127 for AS1 (31.5 °C), 111 for DMSO and 126 for AS1 (33.5 °C), 105 for DMSO and 125 for AS1 (35.5 °C), 73 for DMSO and 124 for AS1 (37.5 °C). * represents significant differences from 31.5 °C DMSO condition, whereas # represents significant differences from the 31.5 °C AS1 condition. D Thermal preference assay (28.5 °C vs 37.5 °C) utilizing nine different structural analogs of AS1. While two analogs slightly decreased the preference for 28.5 °C, only one of them (9089110) abolished preference for either side. N = 84, 59, 58, 46, 59, 55, 53, 32, 61, 59 fish for DMSO, 5538018, 7301738, 7755382, 7947669, 9047736, 9089110, 9089180, 9090934, and 9098532 conditions, respectively. E Analog 9089110 dose–response curve in the non-sensitized thermal preference assay (28.5 vs 37.5 °C). At low concentrations, Analog 9089110 does not influence preference for 28.5 °C, whereas higher concentrations (2.5 and 5 μM) induce preference for the 37.5 °C zone, and the highest concentration tested (10 μM) ablated choice. N = 103, 120, 119, 119, and 86 fish for 0, 1.25, 2.5, 5, and 10 μM Analog 9089110, respectively. F Velocity data for the experiments shown in E. As with AS1, in control (0 μM Analog 9089110) conditions, larval zebrafish locomote at significantly greater velocities in the 37.5 °C zone than the 28.5 °C zone. As the concentration of analog increases, zebrafish instead swim more quickly in the 28.5 °C zone and less quickly in the 37.5 °C zone, although at higher concentrations, zebrafish locomote slowly in both temperature zones, possibly due to motor impairment. */#/+ p < 0.05, **/##/++ p < 0.01, ***/###/+++ p < 0.001. A two-way ANOVA with Tukey’s multiple comparisons test was performed on the data in B, C. A one-way ANOVA with Tukey’s multiple comparisons test was performed on the data in D. A two-way ANOVA with Sidak’s multiple comparisons test was performed on the data in F. For thermal preference assays, a one-sample t test was performed with a hypothetical mean of 50% to determine if fish were significantly choosing one side of the arena over the other. Data shown in A was fit with the log(inhibitor) vs. response—Variable slope (four parameters) nonlinear fit option in GraphPad Prism, whereas the data in E was fit with the nonlinear bell-shaped dose–response curve function in GraphPad Prism |