
- Title
-
Next-generation plasmids for transgenesis in zebrafish and beyond
- Authors
- Kemmler, C.L., Moran, H.R., Murray, B.F., Scoresby, A., Klem, J.R., Eckert, R.L., Lepovsky, E., Bertho, S., Nieuwenhuize, S., Burger, S., D'Agati, G., Betz, C., Puller, A.C., Felker, A., Ditrychova, K., B�tschi, S., Affolter, M., Rohner, N., Lovely, C.B., Kwan, K.M., Burger, A., Mosimann, C.
- Source
- Full text @ Development
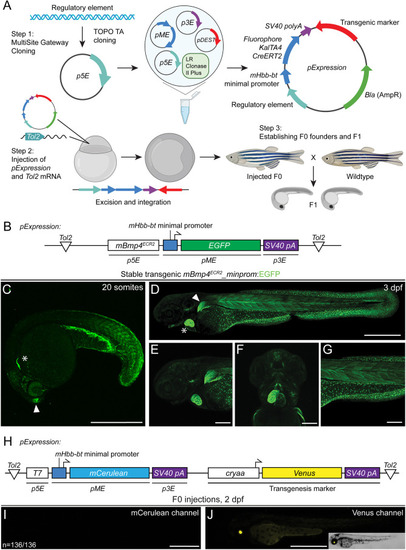
Incorporating the small mouse beta-globin minimal promoter into transgenic reporters. (A) Workflow of reporter generation or enhancer testing with Multisite Gateway recombination and Tol2 transgenesis. An enhancer fragment is cloned into a p5E vector and Gateway- or restriction enzyme-cloned into an expression construct composed of a 5′ fragment, a middle entry mouse beta-globin minimal promoter:fluorophore/KalTa4/creERT2, 3′ SV40 polyA and a transgenic marker (optional). The resulting Tol2 expression construct is injected along with Tol2 transposase-encoding mRNA into one-cell stage zebrafish, randomly integrated into the genome and screened to establish transgenic lines. Schematic created with BioRender.com (license through CU Anschutz). (B) Schematic of mBmp4ECR2_minprom:EGFP containing the distal mouse Bmp4ECR2 element, the mouse beta-globin (Hbb-bt) minimal promoter driving EGFP and the SV40 polyA. (C-G) mBmp4ECR2 reporter expression in a variety of zebrafish tissues linked to endogenous bmp4 expression. (C) Lateral view of a stable transgenic line of mBmp4ECR2_minprom:EGFP at the 20-somite stage; asterisk marks the developing heart; arrowhead indicates the olfactory bulb. (D-F) Lateral (D,E,G) and ventral (F) views of 3 dpf stable mBmp4ECR2_minprom:EGFP transgenic larva (D) show expression in the heart (asterisk) and pectoral fin (arrowhead), as well as in muscles and fins (D,E), parts of the head musculature (F), and in the mesothelium surrounding the yolk, the trunk musculature and fin fibroblasts (G). (H,I) The mHbb-bt minimal promoter has little to no background activity in transient injections. (H) Schematic of expression vector T7_minprom:mCerulean using the bacterial phage T7 promoter (inactive in zebrafish), followed by the mHbb-bt minimal promoter and mCerulean ORF as a reporter. An eye lens-specific cryaa:Venus cassette in cis was used as a transgenesis control. (I,J) Representative 2 dpf embryo of a control or reference injection repeat with T7_minprom:mCerulean, imaged for mCerulean (I) and with Venus as a reference for successful injection (J). There is no detectable mCerulean expression (representative among 136 individually injected embryos in this replicate). Scale bars: 500 μm (C,D,I,J); 200 μm (E-G). |

mCerulean as a versatile blue fluorophore for zebrafish transgenesis. (A) The stable transgenic line for HOPX4q12N3.1_minprom:mCerulean,crybb1:mKate2 shows mCerulean expression in both the vacuolar and sheath cells of the zebrafish notochord at 2 days post-fertilization and eye lens-specific mKate2 expression (asterisk) when crossed with the drl:mCherry transgenic, marking lateral plate mesoderm-derived lineages (cardiovascular system, blood at 2 dpf). (B,C) Transient injection of zebrafish ubiquitin (ubb) promoter-driven mCerulean with 3′ polyadenylation trailer (polyA) from SV40 (B) or ubb (C). (D-F) mCerulean constructs for different cellular localization. Transient expression of cytoplasmic mCerulean (D), nuclear nls-mCerulean (E) and membrane-bound mCerulean-CAAX (F). Scale bars: 500 μm (A-C); 50 μm (D-F). |
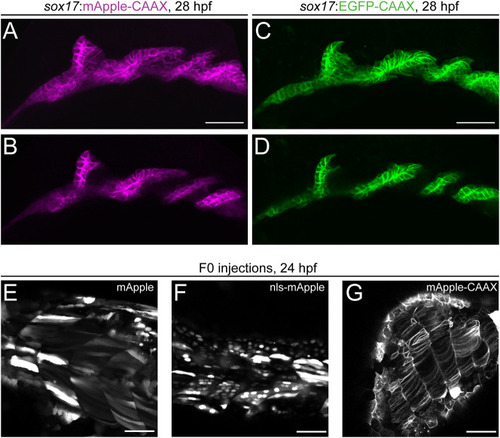
mApple as a bright red fluorophore for zebrafish transgenesis. (A-D) Comparison of membrane-localized mApple-CAAX with EGFP-CAAX in stable sox17:mAppleCAAX and sox17:EGFPCAAX lines show matching expression in the developing pharyngeal endoderm at 28 hpf. Pharyngeal pouches shown in greater detail with anterior towards the left in max projection (A,C) and single slice views (B,D). (E-G) mApple fusion proteins for different localizations. Transient expression of cytoplasmic mApple (E), nuclear nls-mApple (F) and membrane-bound mApple-CAAX (G). Scale bars: 50 µm. |
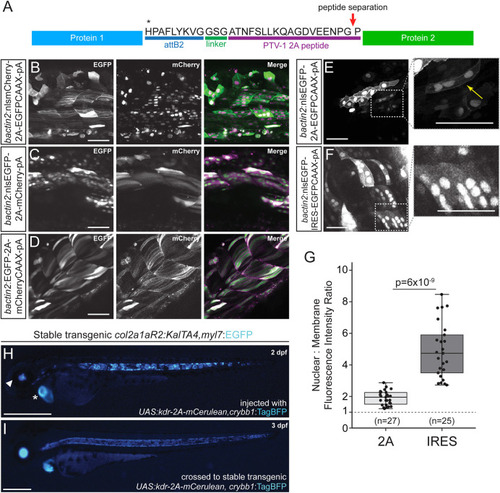
2A peptide linkers for fluorescent protein tagging. (A) Schematic of protein product resulting from a Tol2 construct containing two protein sequences separated by a 2A peptide following the attB2 site of a Multisite Gateway expression construct. Translation of the first protein occurs, the first polypeptide is released at the site of peptide separation and translation of the second ORF proceeds with the same ribosome, resulting in equimolar protein amounts. (B-F) Transient injections of bactin2 promoter-driven fluorophore combinations separated by a 2A peptide tag. nlsmCherry-2A-EGFPCAAX (B), nlsEGFP-2A-mCherry (C) and EGFP-2A-mCherryCAAX (D). Transient injection of bactin2:nlsEGFP-2A-EGFPCAAX (E) demonstrates expression of EGFP in both the nucleus and membrane of cells, whereas injection of bactin2:nlsEGFP-IRES-EGFPCAAX (F) results in poor EGFP-CAAX detection in cells that are positive for nuclear EGFP. (G) Ratio of nuclear to membrane fluorescence intensity with n=total number of cells assayed (numbers at the base of the graph); for each condition, cells from five different embryos were analyzed. Welch's t-test (unequal variance); first and third quartiles are boxed, bars extend to the highest value within the 1.5× inter-quartile range. (H,I) Use of 2A fusions in Gal4/UAS transgene experiments. Injection of UAS:kdr-2A-mCerulean,crybb1:TagBFP into stable transgenic col2a1aR2:KalTA4,myl7:EGFP that expresses codon-optimized Gal4 in the developing notochord and subsequent cartilage lineages shows mosaic mCerulean expression in the developing notochord (H), with the secondary myl7:EGFP transgenic marker indicated with an asterisk and the crybb1:TagBFP marker indicated with an arrowhead. Homogenous notochord expression of mCerulean in stable F2 UAS:kdr-2A-mCerulean,crybb1:TagBFP crossed with col2a1aR2:KalTA4, myl7:EGFP (I). Scale bars: 50 μm (B-F); 500 μm (H,I). |
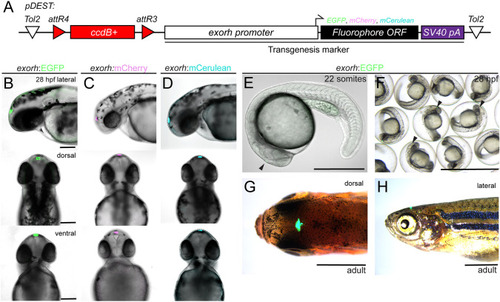
Labeling the zebrafish pineal gland with the exorhodopsin (exorh) regulatory region as a transgenesis marker. (A) Schematic of the Tol2 secondary transgenic marker backbones pCK017 pDEST-exorh:EGFP, pCK053 pDEST-exorh:mCherry and pCK054 pDEST-exorh:mCerulean, including the attR4- and attR3-flanked ccdB cassette followed by the1055 bp exorh promoter driving EGFP, mCherry or mCerulean. (B-D) Stable transgenic lines for EGFP-, mCherry- and mCerulean-based exorh-driven fluorophore reporters; lateral, dorsal and ventral views at 2 dpf showing specific, easily detectable reporter activity in the pineal gland. (E-H) Stages and appearances of exorh-driven transgenesis reporters. Starting at the 22-somite stage (E), exorh:EGFP expression (black arrowhead) is easily detectable in individual embryos and in groups under a standard dissecting microscope (F), while embryos are still in their chorions. exorh-driven fluorophore expression persists into adulthood, as seen in dorsal (G) and lateral (H) views; dissecting microscope images. Scale bars: 200 μm (B-D); 500 μm (E); 0.25 cm (F); 0.5 cm (G,H). |
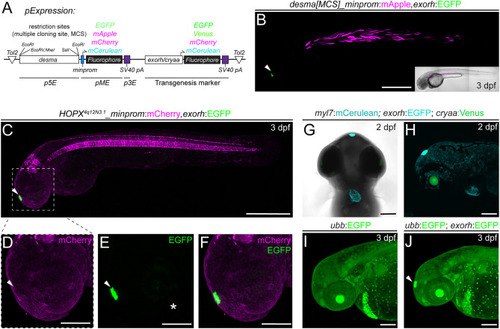
Application examples of an exorh-based, pineal gland-specific transgenesis reporter. (A,B) Injection-based, transient testing and stable transgenesis of regulatory elements with Tol2 vectors that harbor a transgenesis marker in cis for quality control. The desmin a (desma) upstream region paired with the mouse beta-globin minimal promoter driving different fluorophores with exorh- or cryaa-based (eye lens) transgenesis markers in |
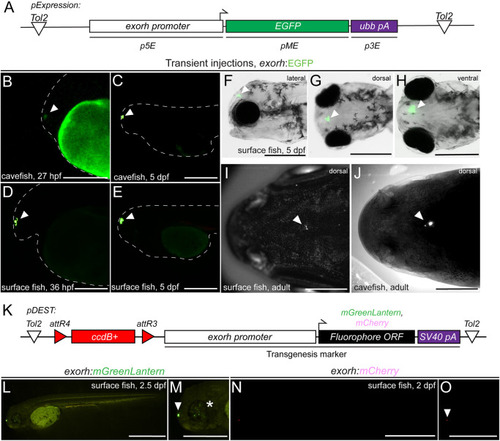
The exorh-based transgenesis marker functions in Mexican cavefish (Astyanax mexicanus). (A) Tol2 expression vector using the zebrafish exorh promoter driving the expression of EGFP; see also. 5. (B-E) Transient injection of exorh:EGFP shows reporter activity in the pineal gland of both Tinaja cavefish at 27 hpf (B) and 5 dpf (C), as well as in surface fish at 36 hpf (D) and 5 dpf (E). Pineal expression is indicated with an arrowhead and embryo morphology traced with a dashed line. (F-H) Lateral, dorsal and ventral views at 5 dpf showing specific, easily detectable EGFP reporter activity in the pineal gland (arrowheads). (I,J) Grayscale images of live exorh:EGFP-injected animals, detection of EGFP (white dots) in surface and cavefish adults (arrowheads). (K) Schematic of Tol2-based transgenesis backbones pDEST-exorh:mGreenLantern and pDEST-exorh:mCherry, including the attR4 and attR3-flanked ccdB cassette, and the 1055 bp zebrafish exorh promoter driving mGreenLantern or mCherry for Multisite Gateway cloning. (L,M) Injection of the exorh:mGreenLantern-containing Tol2 Destination vector shows pineal gland expression (arrowhead) as well as patchy retinal expression in developing surface fish (asterisk). (N,O) Injection of the exorh:mCherry-expressing Tol2 destination vector, showing pineal gland expression in developing cavefish (arrowhead). Scale bars: 200 μm (B-E,M,O); 500 μm (F-H,L,N); 1 cm (I,J). |