
- Title
-
Antialcohol and Hepatoprotective Effects of Tamarind Shell Extract on Ethanol-Induced Damage to HepG2 Cells and Animal Models
- Authors
- Han, S.C., Huang, R.P., Zhang, Q.Y., Yan, C.Y., Li, X.Y., Li, Y.F., He, R.R., Li, W.X.
- Source
- Full text @ Foods
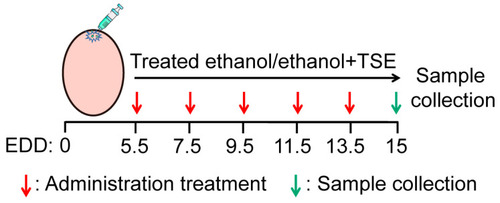
Schematic diagram of chicken embryo treatment protocol. |

TSE protected HepG2 cells against ethanol-induced damage. (A) MTT assay of HepG2 cell viability following treatment with TSE for 24 h, n = 4 biologically independent experiments. (B) MTT assay of HepG2 cell viability following treatment with ethanol for 24 h, n = 4 biologically independent experiments. (C) MTT assay of HepG2 cell viability following pretreatment with or without TSE for 24 h before cotreatment with or without ethanol (700 mM) for 3 h, n = 4 biologically independent experiments. (D) Morphology of cells under microscope (magnification �200). (E) Flow cytometric analysis of intracellular ROS levels detected by DCFH-DA probe, n = 4 biologically independent experiments. (F) Flow cytometric analysis of mitochondrial membrane potential by rhodamine 123 staining, n = 4 biologically independent experiments. Data represent the mean � standard deviation and significant differences were analyzed by one-way ANOVA. ### p < 0.001 vs. control group; *** p < 0.001 vs. ethanol group. ns, not significant vs. ethanol group. |

TSE ameliorated ethanol-induced behavior changes and oxidative stress in zebrafish. (A) TSE was used to treat 5 dpf zebrafish for 96 h to detect the toxicity of TSE. (B) TSE resisted ethanol-induced phenotypic changes in zebrafish, scale bar, 1 mm. (C) TSE ameliorated ethanol-induced behavior changes and increased the movement distance and activity time, n = 5 biologically independent samples. (D) The effect of TSE on the time-dependent changes of ethanol-induced DCF fluorescence intensity. Data represent the mean � standard deviation and significant differences were analyzed by one-way ANOVA. # p < 0.05 vs. control group; * p < 0.05, ** p < 0.01 vs. ethanol group; ns, not significant vs. ethanol group. |

TSE ameliorated ethanol-induced chicken embryo death and liver damage. (A) TSE reversed ethanol-induced chick embryo death rates and (B) liver index, n = 6 biologically independent samples. (C) The effect of TSE on ethanol-induced changes of TG level in chicken embryo liver, n = 6 biologically independent samples. (D) Representative images of chicken embryo liver; scale bar, 1 mm. (E) H&E staining showing the histopathological changes of livers; scale bar, 50 ?m (up), 20 ?m (bottom). (F) Sirius red staining showing liver fibrosis; scale bar, 50 ?m. Data represent the mean � standard deviation and significant differences were analyzed by one-way ANOVA. ### p < 0.001 vs. control group; * p < 0.05, ** p < 0.01, *** p < 0.001 vs. ethanol group; ns, not significant vs. ethanol group. |

TSE ameliorated ethanol-induced metabolism dysregulation in vivo. (A) qRT-PCR analysis of the mRNA levels of cyp2y3, cyp3a65, adh8a, and adh8b in zebrafish, n = 3 biologically independent samples. (B) qRT-PCR analysis of the mRNA levels of Cyp3a4, Cyp3a7, Cyp2d6, and Cyp2c45 in liver tissue, n = 3 biologically independent samples. Activity of (C) CYP2E1, (D) ALDH, and (E) ADH in the chicken embryo liver tissues, n = 6 biologically independent samples. Data represent the mean � standard deviation and significant differences were analyzed by one-way ANOVA. # p < 0.05, ## p < 0.01, ### p < 0.001 vs. control group; * p < 0.05, ** p < 0.01, *** p < 0.001 vs. ethanol group; ns, not significant vs. ethanol group. |

The antioxidant effect of TSE on ethanol-induced chicken embryo liver damage. (A?E) are the effects of TSE on the changes of ethanol-induced (A) SOD, (B) GPx, (C) CAT, (D) T-GSH, and (E) MDA levels in ethanol-induced chicken embryo liver, n = 6 biologically independent samples. Data represent the mean � standard deviation and significant differences were analyzed by one-way ANOVA. # p < 0.05, ### p < 0.001 vs. control group; * p < 0.05, ** p < 0.01, *** p < 0.001 vs. ethanol group; ns, not significant vs. ethanol group. |
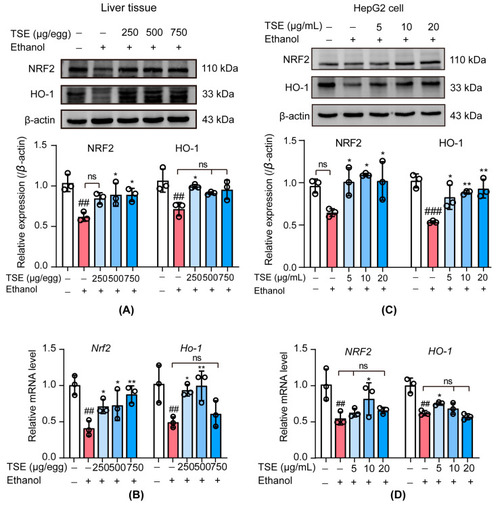
Effect of TSE on NRF2-mediated antioxidant signaling in ethanol-induced liver damage. (A) NRF2 and HO-1 protein expression levels in chicken embryo liver tissue, n = 3 biologically independent samples. (B) qRT-PCR analysis of the mRNA levels of Nrf2 and Ho-1 in chicken embryo liver tissue, n = 3 biologically independent samples. (C) NRF2 and HO-1 protein expression levels in HepG2 cells, n = 3 biologically independent experiments. (D) qRT-PCR analysis of the mRNA levels of NRF2 and HO-1 in HepG2 cells, n = 3 biologically independent experiments. Data represent the mean � standard deviation and significant differences were analyzed by one-way ANOVA. ## p < 0.01, ### p < 0.001 vs. control group; * p < 0.05, ** p < 0.01 vs. ethanol group; ns, not significant vs. ethanol group. |

A schematic illustration of tamarind shell extract against ethanol-induced liver damage. Tamarind shell extract can improve alcohol-induced liver injury by improving alcohol metabolism and activating NRF2 pathway to inhibit oxidative stress. |