
|
Figure 2
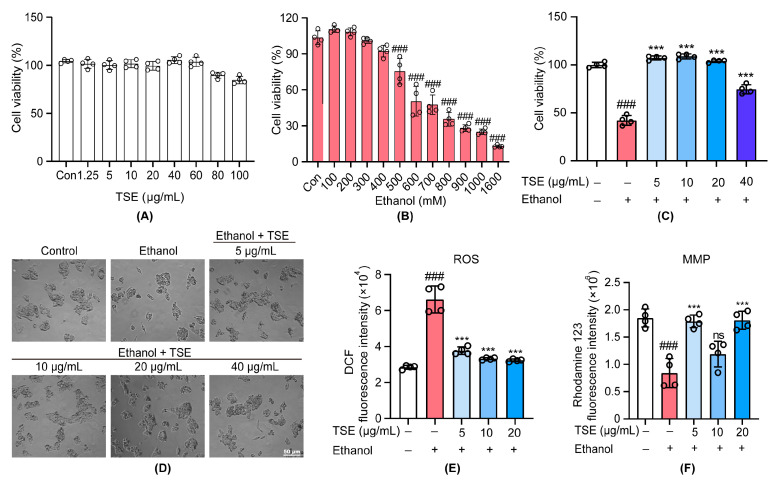
TSE protected HepG2 cells against ethanol-induced damage. (A) MTT assay of HepG2 cell viability following treatment with TSE for 24 h, n = 4 biologically independent experiments. (B) MTT assay of HepG2 cell viability following treatment with ethanol for 24 h, n = 4 biologically independent experiments. (C) MTT assay of HepG2 cell viability following pretreatment with or without TSE for 24 h before cotreatment with or without ethanol (700 mM) for 3 h, n = 4 biologically independent experiments. (D) Morphology of cells under microscope (magnification ×200). (E) Flow cytometric analysis of intracellular ROS levels detected by DCFH-DA probe, n = 4 biologically independent experiments. (F) Flow cytometric analysis of mitochondrial membrane potential by rhodamine 123 staining, n = 4 biologically independent experiments. Data represent the mean ± standard deviation and significant differences were analyzed by one-way ANOVA. ### p < 0.001 vs. control group; *** p < 0.001 vs. ethanol group. ns, not significant vs. ethanol group.