
- Title
-
TEFM variants impair mitochondrial transcription causing childhood-onset neurological disease
- Authors
- Van Haute, L., O'Connor, E., Díaz-Maldonado, H., Munro, B., Polavarapu, K., Hock, D.H., Arunachal, G., Athanasiou-Fragkouli, A., Bardhan, M., Barth, M., Bonneau, D., Brunetti-Pierri, N., Cappuccio, G., Caruana, N.J., Dominik, N., Goel, H., Helman, G., Houlden, H., Lenaers, G., Mention, K., Murphy, D., Nandeesh, B., Olimpio, C., Powell, C.A., Preethish-Kumar, V., Procaccio, V., Rius, R., Rebelo-Guiomar, P., Simons, C., Vengalil, S., Zaki, M.S., Ziegler, A., Thorburn, D.R., Stroud, D.A., Maroofian, R., Christodoulou, J., Gustafsson, C., Nalini, A., Lochmüller, H., Minczuk, M., Horvath, R.
- Source
- Full text @ Nat. Commun.

Pedigrees.
Pedigrees of the five families with associated TEFM variants. |
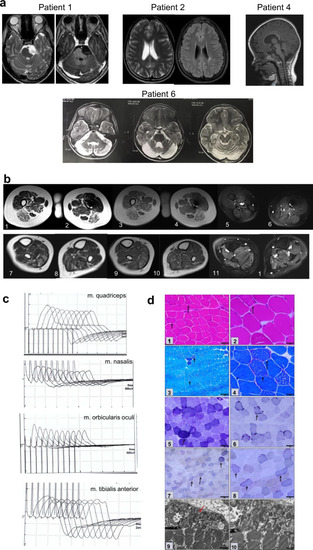
Brain and muscle imaging, muscle histology and repetitive stimulation.
a Patient 1: an epidermoid cyst in pre-pontine cistern. Axial T2 W image and post contrast enhancement of the lesion. Patient 2: Axial T2W and FLAIR images show focal hyperintense area in left periventricular region. Patient 4: loss of white matter and cortical atrophy on FLAIR images. b Muscle MRI images of patient 1. Images in the first row are at mid-thigh level. T2 W axial images (1, 2), T1 W images (3, 4) show atrophy with fatty replacement of bilateral biceps femoris, semimembranosus & semitendinosus. STIR images (5, 6) showing no signal change in the involved muscles. Images in the second row are at calf level. T2 W axial images (7, 8), T1 W axial images (9, 10) are showing fatty replacement of the gastrocnemius & soleus. Axial STIR images (11, 12) show no significant signal changes. c Repetitive standard 3 Hz slow nerve stimulation (5th wave decrement) in Patient 1. Quadriceps demonstrated 21.1% decrement, nasalis shows 30.3%, orbicularis oculi shows 26.5% and no significant decrement detected from the tibialis anterior muscle. d Quadriceps muscle biopsy of patient 1: HE (1–2) showed polygonal fibres with peripherally placed nuclei and minimal variation in fibre size. No evidence of vacuoles, some occasional fibres showed internalized nuclei. Masson’s Trichrome (3) showed no endomysial fibrosis. Modified Gomori (4) trichrome stain showed thin subsarcolemmal accumulation while NADH stain (5–6) showed increase in subsarcolemmal accumulation. COX-SDH stain (7–8) detected COX deficient fibres in more than 50% of fibres. Electron microscopy (9–10) showed abnormal mitochondrial structure and cristae. Scale bar: 1: 50 μm; 2,4: 20 μm; 3,5,6: 100 μm; 7-8: 1 μm. |

TEFM mutations and gene/protein structure.
a Gene structure of TEFM with known protein domains of the gene product and localization of amino acid residues and splice site affected by mutations. The MTS (mitochondrial targeting sequence), the inter-domain linker and the two conserved fold domains (RuvC-type RnaseH-fold domain and a helix–hairpin–helix motif) are indicated. b Conservation of human TEFM amino acid residues affected by mutations across Homo sapiens (Hs), Mus musculus (Mm), Anolis carolinensis (Ac), Xenopus laevis (Xl) and Danio rerio (Dr). c The structure of the human linker (grey) and Rnase H-like domain (blue) of TEFM (PDB: 5OLA) is shown in cartoon indicating the mutation sites. POLRMT is shown in red. d The detailed view of the structural elements at the mutation sites. |
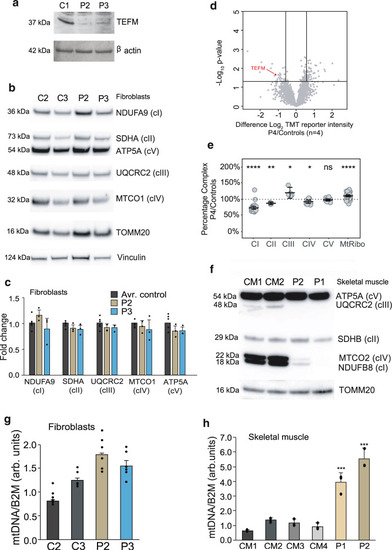
The levels of TEFM and OXPHOS components and mtDNA copy number in patient samples.
a Western blot detecting the TEFM protein in human dermal fibroblasts from patients 2 (P2) and 3 (P3). β-actin was used as a loading control. b Representative example of western blot analysis of NDUFB9 (complex I, cI), SDHA (complex II, cII), UQCRC2 (complex III, cIII), MTCO1 (complex IV, cIV), and ATP5A (complex V, cV) for fibroblasts from patients 2 (P2) and 3 (P3) and wild-type controls (C2 and C3). TOMM20 and Vinculin were used as loading controls. c Quantification of 3 western blot experiments as per (b). Data were statistically analyzed by two- tailed Student’s t-test. Error bars = mean ± 1 standard deviation, n = 3. d Volcano plot comparing whole-cell protein abundances for proteins quantified in P4 fibroblasts (n = 2 technical) relative to control fibroblasts (n = 4 biological). TEFM protein is highlighted in red. Significance lines were plotted at p-value <0.05 and log2 difference 0.585 (1.5-fold change equivalent) from two-sample t-test analysis. e Relative complex abundance of quantitative proteomics data plotted as a ratio of each subunit in TEFM/controls and represented as a percentage. The middle bar represents the mean value for the subunits in each complex, upper and lower bars represent 95% confidence interval of the mean value. A paired t-test calculated the significance between the control and patient for each complex. P values are indicated as ****p ≤ 0.0001; **p ≤ 0.01, *p ≤ 0.05, ns = not significant. Middle dotted line represents 100%, or no change between the TEFM and controls. f Representative example of western blot analysis of NDUFB8 (complex I, cI), SDHB (complex II, cII), UQCRC2 (complex III, cIII), MTCO2 (complex IV, cIV), and ATP5A (complex V, cV) for skeletal muscle samples from patients 1 (P1) and 2 (P2) and wild-type controls (CM1 and CM2). g mtDNA copy-number determination by qPCR of mtDNA fragments relative to the nuclear B2M gene for fibroblasts of P2 and P3 and the wild-type controls. Statistical analysis was carried out using a two-tailed student’s t-test. Error bars = mean ± 1 standard deviation, n = 6 (technical replicates, ns ≥ 0.05). h mtDNA copy-number determination by qPCR of mtDNA fragments relative to the nuclear B2M gene in skeletal muscle samples of P1 and P2 and wild-type controls. Statistical analysis was carried out using a two-tailed student’s t-test. Error bars = mean ± 1 standard deviation, n = 3 (technical replicates); *p ≤ 0.05; **p ≤ 0.01. Source data are provided as a Source Data file. |
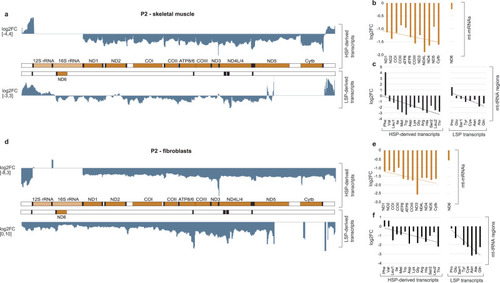
Mitochondrial transcriptome in TEFM patients.
a Transcriptome-wide RNA-Seq analysis showing the effects of TEFM loss in skeletal muscle of patient 2 (P2) on mtRNA transcripts. A map of mtDNA showing the change in sequence read coverage (log2 fold change between patient 2 and two healthy controls) on both strands. b Quantification of the difference in reads per gene between skeletal muscle from P2 and from two healthy controls (n = 3 technical replicates) for mt-mRNA derived reads for both strands, from proximal to distal from the promoter and c reads corresponding to mt-tRNA for both strands in the order they are transcribed (n = 3 technical replicates) d Transcriptome-wide RNA-Seq analysis of the effects of TEFM loss in fibroblast cells of P2 on mtRNA transcripts. A map of mtDNA showing the change in sequence read coverage (log2 fold change between P2 and fibroblast cells from healthy controls) on both strands. e Quantification of the differences in number of reads per gene between fibroblasts from P2 and from two healthy controls (n = 3 technical replicates) for mt-mRNA reads and f reads corresponding to mt-tRNA fragments in the order they are transcribed from the promoter (n = 3 technical replicates). All trend lines were fitted by linear regression. Source data are provided as a Source Data file. |

In vitro analysis of TEFM variants.
a SDS-PAGE analysis of the purified recombinant WT TEFM (amino acids 36–360) and the TEFM mutants used in the in vitro experiments. Molecular weight marker is indicated in the first lane. b DNA sequence (447–196) included in the mitochondrial Non-Coding Region (NCR), harbouring the transcription start site (+1) of the light strand promoter (LSP) and the Conserved Sequence Blocks (CSB) I, II and III. Highlighted are the CSB II sequence variants used in biochemical assays, G5AG7, G6AG7 and G8AG8. c–e CSB II sequence heterogeneity affects the capacity of TEFM mutants of preventing premature transcription termination at the CSB II region. Left panels: in vitro transcription from linearized templates that generate transcripts of ~400 nt (R.O.). Three templates with different (G)-tract sequence at CSB II were used: G5AG7 (c), G6AG7 (d) and G8AG8 (e). WT and TEFM mutants (250 fmol as a dimer) were assayed for their ability to abolish transcription termination at CSB II in each template. Right panels: The mean value of termination at different CSB II variants in the in vitro transcription. Error bars represent mean ± SD of three technical repeats, ns not significant, *p ≤ 0.05; **p ≤ 0.01; ***p ≤ 0.001 (two-tailed Student’s t test for comparison to reactions with WT TEFM). Source data are provided as a Source Data file. |

Early movement behaviours and neuromuscular junction morphology of tefm-MO and tefm (F0) zebrafish.
a Chorion rotations per minute (p < 0.0001, two-sided Mann–Whitney test, n = 133 control and 132 tefm-MO), ****p < 0.0001. b Mean chorion rotation duration in seconds (p = 0.015, two-sided Mann–Whitney test, n = 128 control and 121 tefm-MO), *p < 0.05. c Percentage of time spent moving in control and tefm-MO zebrafish at 1 dpf (p = 0.0006, two-sided Mann–Whitney test, n = 133 control and 167 tefm-MO), ***p < 0.001. d Representative images of neuromuscular junctions from wild-type (WT) and tefm-MO zebrafish at 2 dpf (days post fertilization). Acetylcholine receptors (AChRs) are stained with fluorophore bound α-bungarotoxin (aBt, green), and motor neurons detected with an antibody against synaptic vesicle protein 2 (SV2, red). White arrows indicate points of interest, such as lack of neuron outgrowth or improper neuron migration. Scale bar = 50 µm. e Average size of SV2 clusters (p < 0.0001, two-sided unpaired t-test, n = 12 WT and n = 15 tefm-MO), ****p < 0.0001. f Number of SV2-positive clusters per 100 µm2 (p = 0.124, two-sided Mann–Whitney test, n = 12 WT and n = 15 tefm-MO), ns not significant. g Average size of aBt clusters (p = 0.788 two-sided Mann–Whitney test, n = 12 WT and n = 15 tefm-MO), ns not significant. h Number of aBt-positive clusters per 100 µm2 (p = 0.196 two-sided Mann–Whitney test, n = 12 WT and n = 15 tefm-MO), ns not significant. i Colocalization of SV2-positive signal with αBT on fast muscle using Mander’s correlation coefficient (0 = no colocalization, 1 = full colocalization, p < 0.0001, two-sided nested t-test, n = 10 WT and n = 15 tefm-MO), ****p < 0.0001. j Colocalization of αBT with SV2-positive signal on fast muscle (p < 0.0001, two-sided nested t-test, n = 10 WT and n = 15 tefm-MO), ****p < 0.0001. k Colocalization of SV2-positive signal with αBT on slow muscle (p = 0.0003, respectively, two-sided unpaired t-test, n = 10 WT and n = 15 tefm-MO), ***p < 0.001. l Colocalization of αBT with SV2-positive signal on slow muscle (p < 0.0001, respectively, two-sided unpaired t-test, n = 10 WT and n = 15 tefm-MO), ****p < 0.001. Dashed line shows the median, dotted lines show the quartiles. |
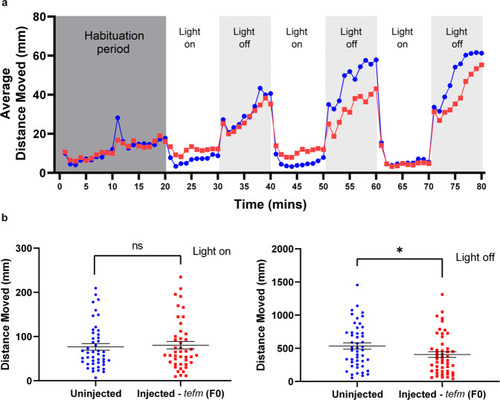
Movement analysis of tefm (F0) zebrafish.
a Average distance moved (mm) of 5 dpf uninjected (blue circles) and injected - tefm (F0) (red squares) zebrafish exposed to three cycles of 10 min light on and 10 min light off after a 20-min habituation period. Each point represents 1 min, n = 48 uninjected and n = 48 injected - tefm (F0). b Total distance moved (mm) of 5 dpf uninjected (blue circles) and injected - tefm (F0) (red squares) zebrafish for the first 5-min of light on (left image) and light off (right image) periods from (a). Right image (light off), p = 0.0395, two-sided Mann–Whitney test, n = 48 uninjected and 48 injected – tefm (F0). Left image (light on), p = 0.5767, two-sided Mann–Whitney test. Error bars = mean ± SEM ns not significant, *p < 0.005. Source data are provided as a Source Data file. PHENOTYPE:
|

ZFIN is incorporating published figure images and captions as part of an ongoing project. Figures from some publications have not yet been curated, or are not available for display because of copyright restrictions. |