
Fig. 5
- ID
- ZDB-IMAGE-230228-80
- Publication
- Van Haute et al., 2023 - TEFM variants impair mitochondrial transcription causing childhood-onset neurological disease
- All Figures
- Figures for Van Haute et al., 2023
|
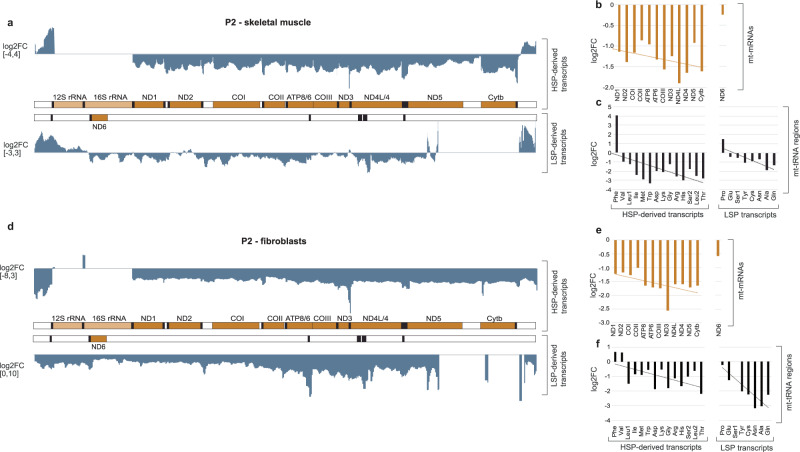
Fig. 5
a Transcriptome-wide RNA-Seq analysis showing the effects of TEFM loss in skeletal muscle of patient 2 (P2) on mtRNA transcripts. A map of mtDNA showing the change in sequence read coverage (log2 fold change between patient 2 and two healthy controls) on both strands. b Quantification of the difference in reads per gene between skeletal muscle from P2 and from two healthy controls (n = 3 technical replicates) for mt-mRNA derived reads for both strands, from proximal to distal from the promoter and c reads corresponding to mt-tRNA for both strands in the order they are transcribed (n = 3 technical replicates) d Transcriptome-wide RNA-Seq analysis of the effects of TEFM loss in fibroblast cells of P2 on mtRNA transcripts. A map of mtDNA showing the change in sequence read coverage (log2 fold change between P2 and fibroblast cells from healthy controls) on both strands. e Quantification of the differences in number of reads per gene between fibroblasts from P2 and from two healthy controls (n = 3 technical replicates) for mt-mRNA reads and f reads corresponding to mt-tRNA fragments in the order they are transcribed from the promoter (n = 3 technical replicates). All trend lines were fitted by linear regression. Source data are provided as a Source Data file.