
Fig. 4
- ID
- ZDB-IMAGE-230228-78
- Publication
- Van Haute et al., 2023 - TEFM variants impair mitochondrial transcription causing childhood-onset neurological disease
- All Figures
- Figures for Van Haute et al., 2023
|
Fig. 4
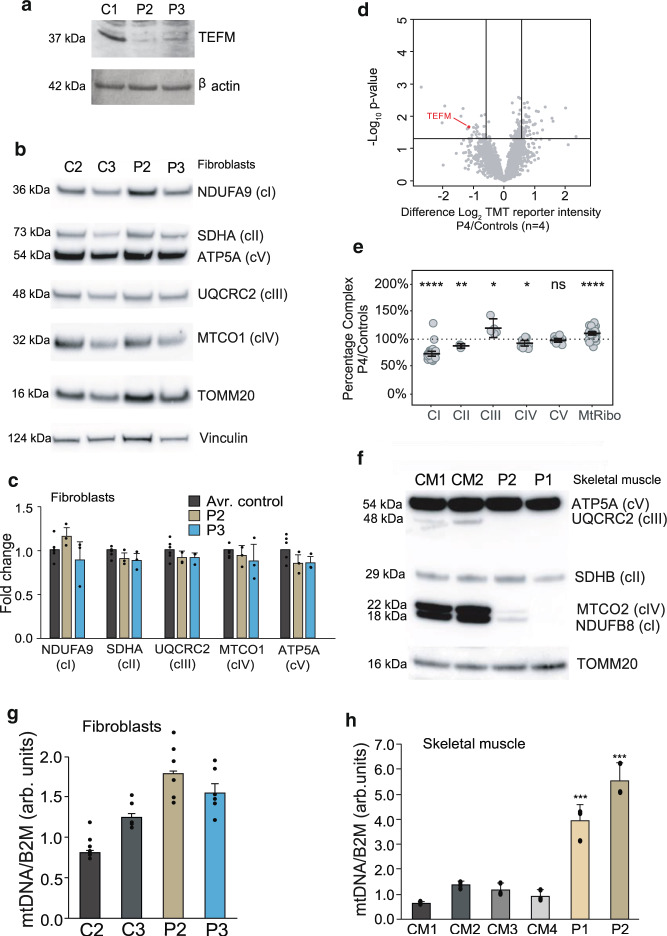
a Western blot detecting the TEFM protein in human dermal fibroblasts from patients 2 (P2) and 3 (P3). β-actin was used as a loading control. b Representative example of western blot analysis of NDUFB9 (complex I, cI), SDHA (complex II, cII), UQCRC2 (complex III, cIII), MTCO1 (complex IV, cIV), and ATP5A (complex V, cV) for fibroblasts from patients 2 (P2) and 3 (P3) and wild-type controls (C2 and C3). TOMM20 and Vinculin were used as loading controls. c Quantification of 3 western blot experiments as per (b). Data were statistically analyzed by two- tailed Student’s t-test. Error bars = mean ± 1 standard deviation, n = 3. d Volcano plot comparing whole-cell protein abundances for proteins quantified in P4 fibroblasts (n = 2 technical) relative to control fibroblasts (n = 4 biological). TEFM protein is highlighted in red. Significance lines were plotted at p-value <0.05 and log2 difference 0.585 (1.5-fold change equivalent) from two-sample t-test analysis. e Relative complex abundance of quantitative proteomics data plotted as a ratio of each subunit in TEFM/controls and represented as a percentage. The middle bar represents the mean value for the subunits in each complex, upper and lower bars represent 95% confidence interval of the mean value. A paired t-test calculated the significance between the control and patient for each complex. P values are indicated as ****p ≤ 0.0001; **p ≤ 0.01, *p ≤ 0.05, ns = not significant. Middle dotted line represents 100%, or no change between the TEFM and controls. f Representative example of western blot analysis of NDUFB8 (complex I, cI), SDHB (complex II, cII), UQCRC2 (complex III, cIII), MTCO2 (complex IV, cIV), and ATP5A (complex V, cV) for skeletal muscle samples from patients 1 (P1) and 2 (P2) and wild-type controls (CM1 and CM2). g mtDNA copy-number determination by qPCR of mtDNA fragments relative to the nuclear B2M gene for fibroblasts of P2 and P3 and the wild-type controls. Statistical analysis was carried out using a two-tailed student’s t-test. Error bars = mean ± 1 standard deviation, n = 6 (technical replicates, ns ≥ 0.05). h mtDNA copy-number determination by qPCR of mtDNA fragments relative to the nuclear B2M gene in skeletal muscle samples of P1 and P2 and wild-type controls. Statistical analysis was carried out using a two-tailed student’s t-test. Error bars = mean ± 1 standard deviation, n = 3 (technical replicates); *p ≤ 0.05; **p ≤ 0.01. Source data are provided as a Source Data file.