
- Title
-
Design, Synthesis, Biological Evaluation, and Preliminary Mechanistic Study of a Novel Mitochondrial-Targeted Xanthone
- Authors
- Wang, S., Zhang, Q., Peng, M., Xu, J., Guo, Y.
- Source
- Full text @ Molecules
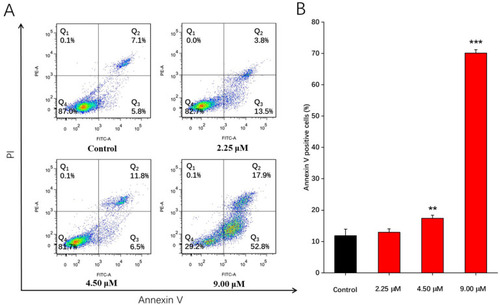
Compound 1b-induced apoptosis on A549 cells. A549 cells were treated with 2.25, 4.50, and 9.00 μM of compound 1b for 48 h. DMSO was used as a negative control. Apoptotic levels were assessed using Annexin V FITC/PI double staining and flow cytometry. (A) Flow cytometric analysis of A549 cell distribution after treatment with different concentrations of compound 1b. (B) Related histogram for apoptotic cells are expressed as the means ± SD (n = 3). ** p < 0.01, *** p < 0.001 vs. the control group. |
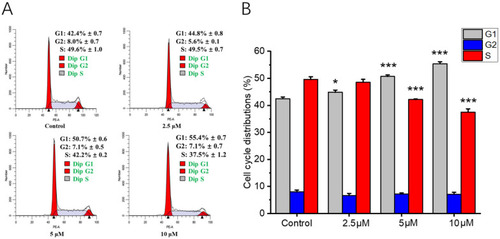
Arrest effects of compound 1b on cell cycle distribution in A549 cells. A549 cells were treated with 2.5, 5, and 10 μM of compound 1b for 48 h. DMSO was used as a negative control. (A) The cell cycle ratio of A549 cells was detected using a cell cycle staining kit, and the cell cycle distribution was analyzed using flow cytometry. (B) Related histogram of cell cycle phases distribution, expressed as the mean ± SD (n = 3). * p < 0.05, *** p < 0.001 vs. the control group. |
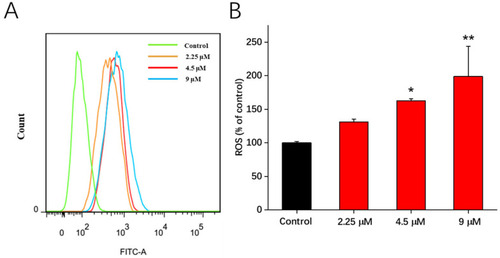
Effects of compound 1b on ROS generation in A549 cells. Cells were treated with compound 1b at the tested concentrations for 48 h. (A) ROS production in A549 cells was measured via flow cytometric analysis using DCFH-DA staining. (B) Related histograms for ROS levels are presented as the means ± SD (n = 3). * p < 0.05, ** p < 0.01 vs. the control group. |
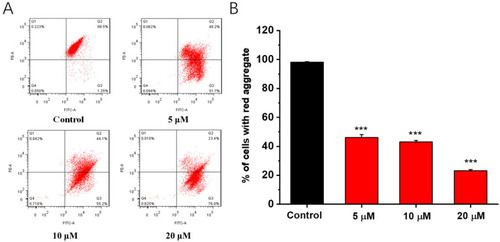
Effects of compound 1b on mitochondrial membrane potential (Δψm) in A549 cells. (A) Cells were treated with compound 1b at the tested concentrations for 48 h and stained with JC-1 dye. Δψm was analyzed via flow cytometry. (B) The quantification of % of cells with red aggregates. The values are presented as the means ± SD (n = 3). *** p < 0.001 vs. control group. |
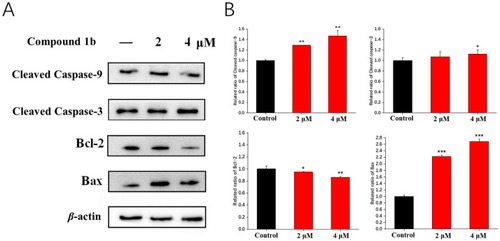
Effects of compound 1b on the expression of four apoptosis-related proteins. Cells were treated with compound 1b at the indicated concentrations for 48 h. (A) Representative images of Western blotting analysis of cleaved caspase-9, cleaved caspase-3, Bcl-2, and Bax. (B) Quantitative analyses of Western blotting are presented as the means ± SD (n = 3). * p < 0.05, ** p < 0.01, *** p < 0.001 vs. the control group. |
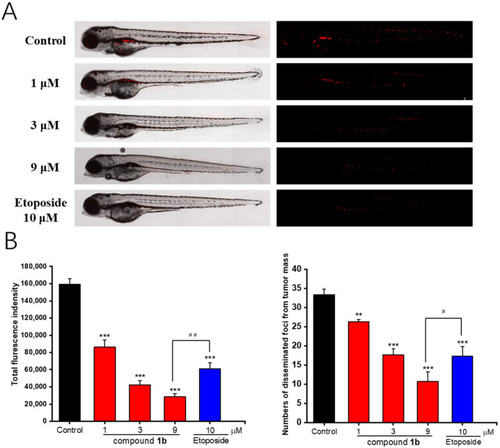
In vivo antitumor effects of compound 1b in zebrafish xenografts. CM-DiI-stained A549 cells were transplanted into two dpf zebrafish embryos via microinjection. (A) Representative images of the relative intensity and distribution of the red fluorescence using confocal microscopy after testing the concentration of compound 1b administration (1, 3, and 9 μM) for 48 h. (B) Histogram of fluorescence intensities and quantification of the fluorescent area of the compound 1b-treated tumor xenografts. Results are presented as the means ± SD (n = 3). ** p < 0.01, *** p < 0.001 vs. the control group. # p < 0.05, ## p < 0.01 vs. the positive control etoposide. |
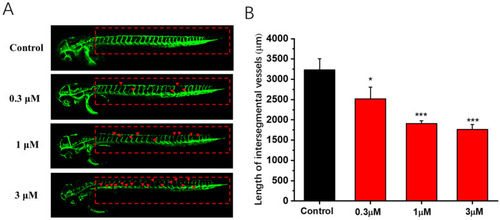
Antiangiogenesis activity of compound 1b in the transgenic zebrafish model. (A) Representative images of zebrafish embryos from transgenic zebrafish Tg (fli1:EGFP) treated with the vehicle and different concentrations of compound 1b (0.3, 1, and 3 μM) at 48 hpf. The absence and breakage of ISVs are indicated by red arrows. (B) Average total lengths of the ISVs of zebrafish after treatment with various concentrations of compound 1b. Results are presented as the means ± SD (n = 3). * p < 0.05, *** p < 0.001 vs. the control group. |