
- Title
-
Recovery of a hypolipidemic polysaccharide from artificially cultivated Sanghuangporus vaninii with an effective method
- Authors
- Zhang, Z.F., Song, T.T., Chen, J.F., Lv, G.Y.
- Source
- Full text @ Front Nutr
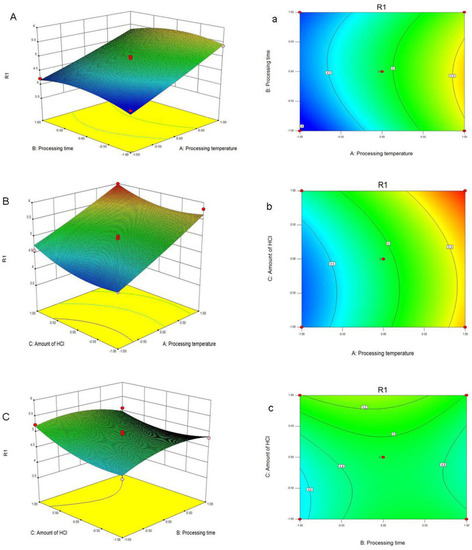
Response surface plots |
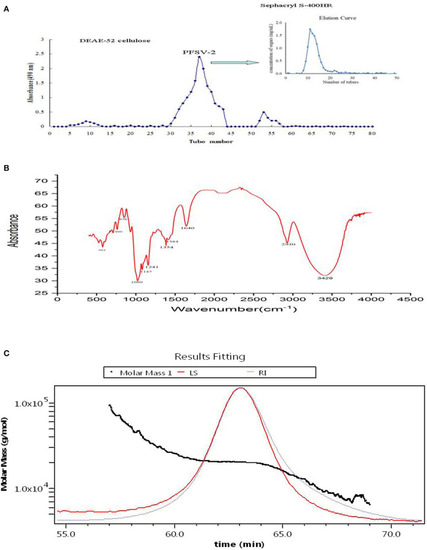
Elution curve of crude PFSV on DEAE-52 cellulose and sephacryl S-400HR chromatography column (A); FT-IR spectrum of PFSV-2 (B); and chromatograms of the molar mass distribution of PFSV-2 (C). |
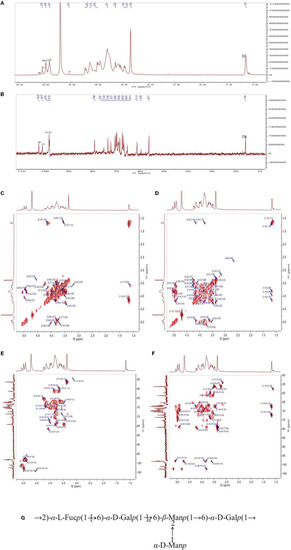
The 1H-NMR (A), 13C (B) NMR, 1H-1H COSY (C), NOESY (D), HSQC (E), and HMBC (F) spectra of PFSV-2. The predicted structure of PFSV-2 (G). |
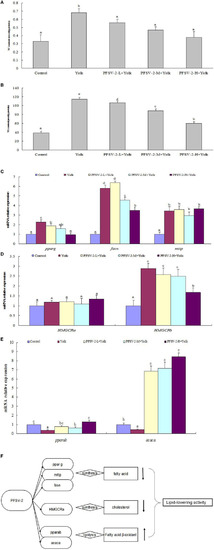
Total cholesterol [TC, (A)] and triglyceride [TG, (B)] levels of larval zebrafish in each group (n = 3); mRNA expression of pparg, fasn, and mtp on zebrafish larvae (C); mRNA expression of pparab and acaca on zebrafish larvae (D), mRNA expression of HMGCRa and HMGCRb on zebrafish larvae (E), and molecular mechanisms of lipid metabolism modulation by PFSV-2 (F). Bar indicates means ± SD. Bars without the same superscripts (a–e) denote significant difference (p < 0.05). |