
Image
|
Figure Caption
Figure 2
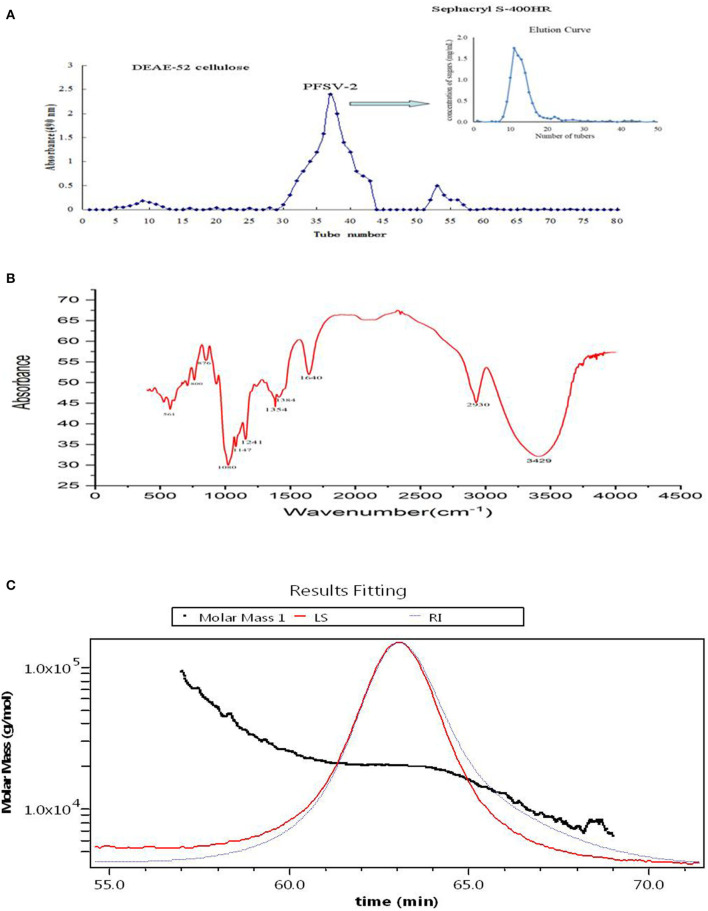
Elution curve of crude PFSV on DEAE-52 cellulose and sephacryl S-400HR chromatography column (A); FT-IR spectrum of PFSV-2 (B); and chromatograms of the molar mass distribution of PFSV-2 (C).
Acknowledgments
This image is the copyrighted work of the attributed author or publisher, and
ZFIN has permission only to display this image to its users.
Additional permissions should be obtained from the applicable author or publisher of the image.
Full text @ Front Nutr