
- Title
-
Role of Herbal Extracts of Catechu from Uncaria gambir in the Treatment of Chronic Diabetic Wounds
- Authors
- Ho, T.J., Tsai, P.H., Hsieh, C.H., Lin, J.H., Lin, Y.W., Wu, J.R., Chen, H.P.
- Source
- Full text @ Pharmaceuticals (Basel)

Appearance of catechu blocks. |
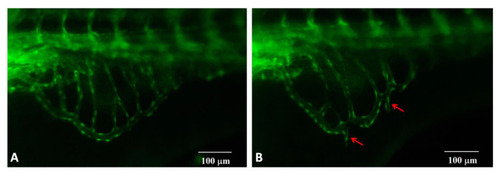
The pro-angiogenic effects on zebrafish embryos in the presence of 300 μg/mL catechu extracts. (A) Control, and (B) Catechu extract-treated. Red arrows indicate the formation of extra sprouts in the sub-intestinal veins of fish embryos. Sprout blood vessel number and blood vessel length are listed. About twenty embryos were used for each group. The measured blood vessel length unit (px) is defined using the software WenXin WximageView. |
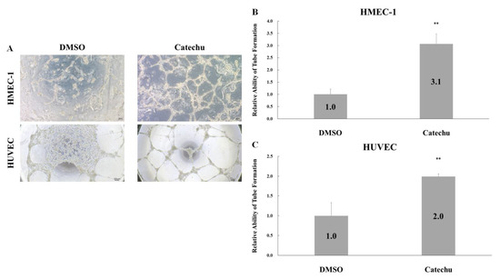
Effect of catechu extracts on the tube and network formation of HMEC-1 and HUVEC cells. (A) Representative photos of the tube formation assay at 24 h. HMEC-1 and HUVEC cells were treated with 0.8 ng/mL and 1.0 ng/mL crude catechu extracts, respectively. The network formation was quantified by the mesh number formation for (B) HMEC-1 and (C) HUVEC cells. Data are presented as means ± SD in three independent experiments. The p-value was calculated versus the control using one-tailed test analysis; p < 0.005 is denoted as **. |
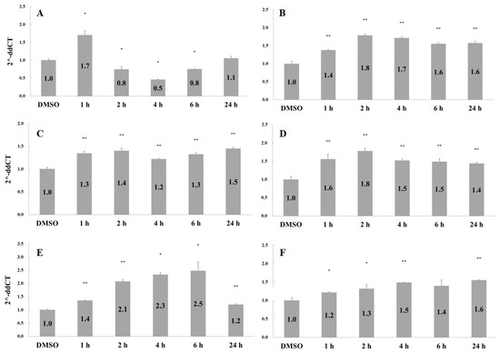
Effects of catechu extracts on gene expression. HMEC-1 cells were treated with 0.1 ng/mL of catechu extracts for 1, 2, 4, 6, and 24 h. The gene expression levels for (A) IL-8, (B) FGFR2, (C) FGFR3, (D) NF-kB, (E) STAT3, and (F) vimentin were examined by quantitative PCR. Data are presented as means ± SD in three independent experiments. The p-value was calculated versus the control. Using one-tailed test analysis, * indicates p < 0.05 and ** indicates p < 0.005 between different times after catechu treatment. The DMSO group was the solvent control. |
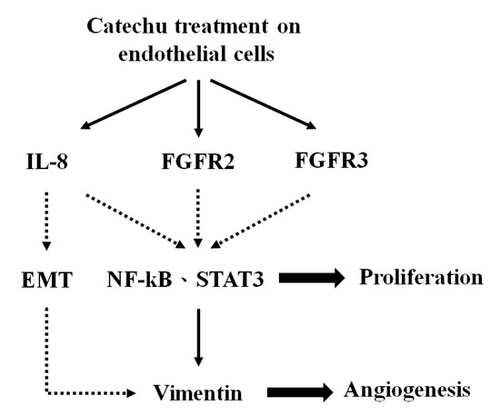
Summary of the possible mechanism underlying the angiogenic effect of catechu extracts in HMEC1 cells. |

Effects of catechu extracts on (A) WS1 and (B) HaCaT proliferation. Increased cell proliferation was observed after treatment with catechu extracts for 24 h. Data are presented as means ± SD in three independent experiments. The p-value was calculated versus the control. Using the one-tailed test analysis, * indicates p < 0.05 and ** indicates p < 0.005 between different catechu concentrations. |
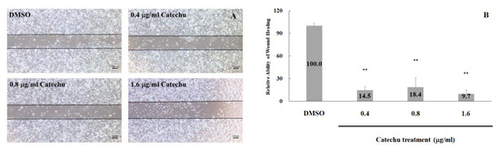
Effects of catechu extracts on wound healing. HaCaT cells were treated with 0.4, 0.8, and 1.6 mg/mL catechu extracts for 48 h. (A) The black lines denote the size of the cell-free gap at the beginning of the catechu treatment. HaCaT cells that migrated into the black lines were calculated using ImageJ after 48 h. The quantitation data of wound healing ability are shown in (B). Data are presented as means ± SD in three independent experiments. Statistical significance: ** p < 0.005 versus the control group (Con) using the one-tailed test analysis. The DMSO group was the solvent control. |