
Image
|
Figure Caption
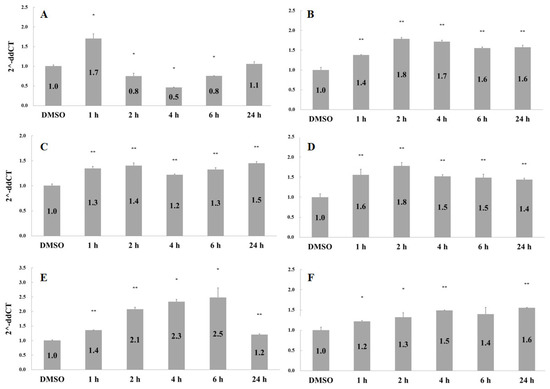
Fig. 4 Effects of catechu extracts on gene expression. HMEC-1 cells were treated with 0.1 ng/mL of catechu extracts for 1, 2, 4, 6, and 24 h. The gene expression levels for (A) IL-8, (B) FGFR2, (C) FGFR3, (D) NF-kB, (E) STAT3, and (F) vimentin were examined by quantitative PCR. Data are presented as means ± SD in three independent experiments. The p-value was calculated versus the control. Using one-tailed test analysis, * indicates p < 0.05 and ** indicates p < 0.005 between different times after catechu treatment. The DMSO group was the solvent control.
Acknowledgments
This image is the copyrighted work of the attributed author or publisher, and
ZFIN has permission only to display this image to its users.
Additional permissions should be obtained from the applicable author or publisher of the image.
Full text @ Pharmaceuticals (Basel)