
Image
|
Figure Caption
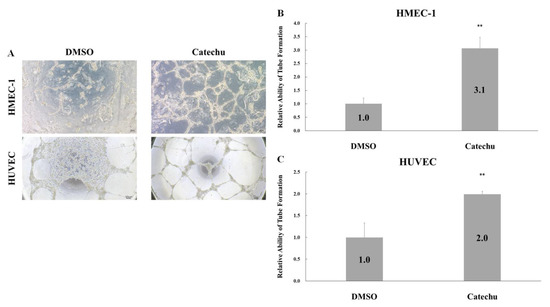
Fig. 3 Effect of catechu extracts on the tube and network formation of HMEC-1 and HUVEC cells. (A) Representative photos of the tube formation assay at 24 h. HMEC-1 and HUVEC cells were treated with 0.8 ng/mL and 1.0 ng/mL crude catechu extracts, respectively. The network formation was quantified by the mesh number formation for (B) HMEC-1 and (C) HUVEC cells. Data are presented as means ± SD in three independent experiments. The p-value was calculated versus the control using one-tailed test analysis; p < 0.005 is denoted as **.
Acknowledgments
This image is the copyrighted work of the attributed author or publisher, and
ZFIN has permission only to display this image to its users.
Additional permissions should be obtained from the applicable author or publisher of the image.
Full text @ Pharmaceuticals (Basel)