
- Title
-
Profiling the Spatial Expression Pattern and ceRNA Network of lncRNA, miRNA, and mRNA Associated with the Development of Intermuscular Bones in Zebrafish
- Authors
- Ye, W., Shi, M., Ren, K., Liu, Y., Duan, Y., Cheng, Y., Zhang, W., Xia, X.Q.
- Source
- Full text @ Biology (Basel)
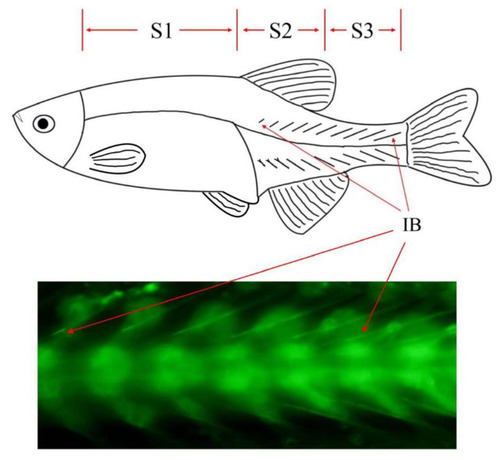
Phenotypic characteristics and sampling scheme of zebrafish IBs. |
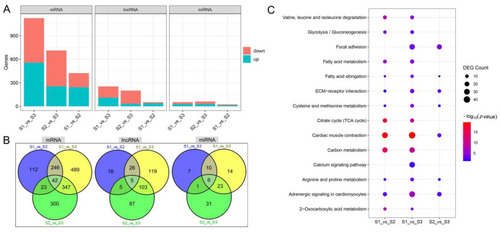
DEGs between S1, S2, and S3 segments. (A) The number of DEmRNAs, DElncRNAs, and DEmiRNAs of S1_vs_S2, S1_vs_S3, and S2_vs_S3. (B) Differences in the composition of DEmRNAs, DElncRNAs, and DEmiRNAs in S1_vs_S2, S1_vs_S3, and S2_vs_S3. (C) Differences in KEGG enrichment results of DEmRNAs of S1_vs_S2, S1_vs_S3, and S2_vs_S3. |
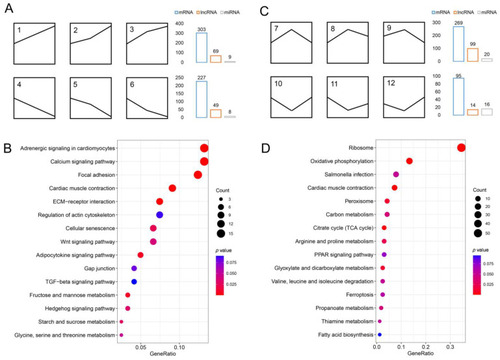
Identification of mRNA, lncRNA, and miRNA associated with the development and formation of IBs. (A) Six gene expression patterns were associated with IB development: 1, 2, and 3, were upregulated, and 4, 5, and 6 were downregulated. (B) The top 15 pathways from KEGG enrichment results of DEmRNAs were associated with the growth of IBs. (C) Six gene expression patterns were associated with the formation of IBs: 7, 8, and 9, were upregulated, whereas 10, 11, and 12 were down-regulated. (D) The top 15 pathways from KEGG enrichment results of DEmRNAs were associated with the formation of IBs. |
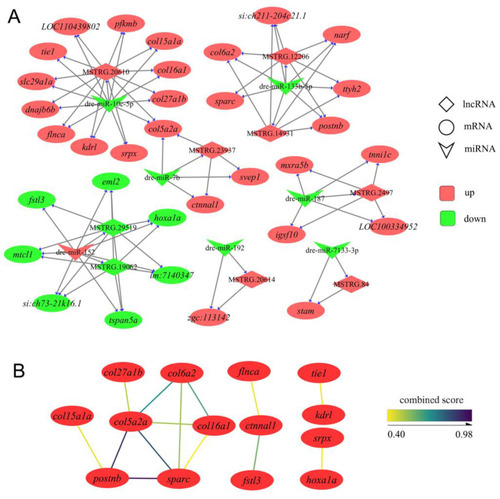
The details of ceRNA networks associated with the development of IBs. (A) The ceRNA networks are associated with IB development. Red represents upregulation, and the green represents downregulation. (B) Protein interactions are present in the ceRNA networks. |
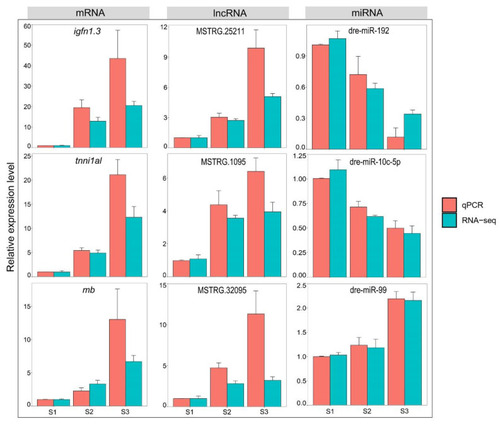
Comparison of RNA-seq data and RT-qPCR data. |