
Image
|
Figure Caption
Figure 4
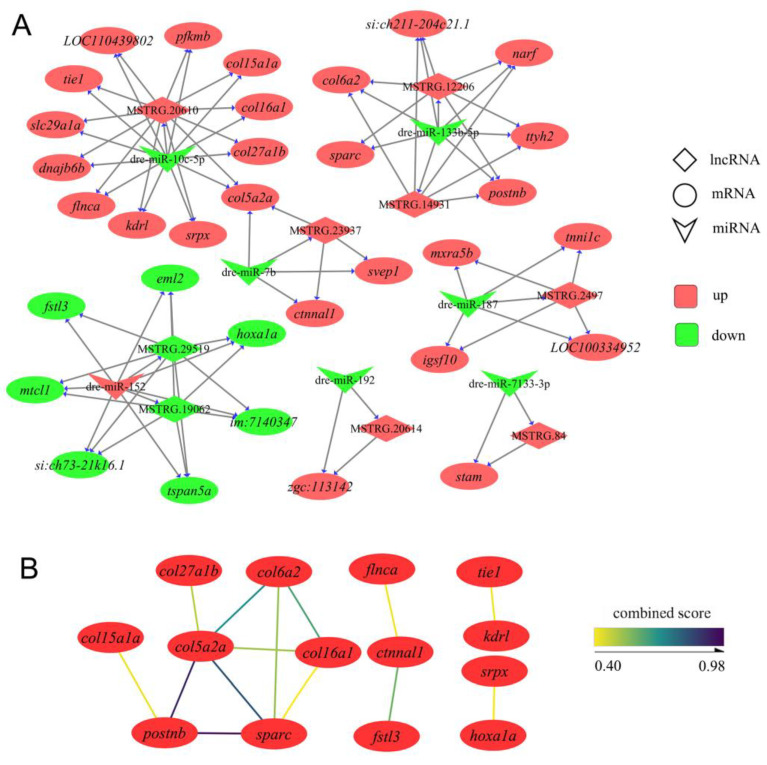
The details of ceRNA networks associated with the development of IBs. (A) The ceRNA networks are associated with IB development. Red represents upregulation, and the green represents downregulation. (B) Protein interactions are present in the ceRNA networks.
Acknowledgments
This image is the copyrighted work of the attributed author or publisher, and
ZFIN has permission only to display this image to its users.
Additional permissions should be obtained from the applicable author or publisher of the image.
Full text @ Biology (Basel)