
FIGURE
Figure 2
- ID
- ZDB-FIG-230124-145
- Publication
- Ye et al., 2022 - Profiling the Spatial Expression Pattern and ceRNA Network of lncRNA, miRNA, and mRNA Associated with the Development of Intermuscular Bones in Zebrafish
- Other Figures
- All Figure Page
- Back to All Figure Page
Figure 2
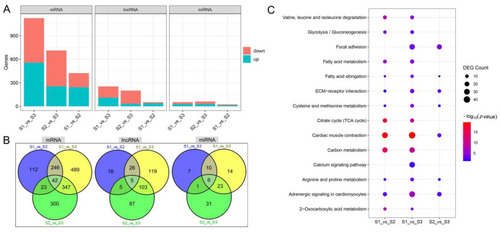
DEGs between S1, S2, and S3 segments. (A) The number of DEmRNAs, DElncRNAs, and DEmiRNAs of S1_vs_S2, S1_vs_S3, and S2_vs_S3. (B) Differences in the composition of DEmRNAs, DElncRNAs, and DEmiRNAs in S1_vs_S2, S1_vs_S3, and S2_vs_S3. (C) Differences in KEGG enrichment results of DEmRNAs of S1_vs_S2, S1_vs_S3, and S2_vs_S3. |
Expression Data
Expression Detail
Antibody Labeling
Phenotype Data
Phenotype Detail
Acknowledgments
This image is the copyrighted work of the attributed author or publisher, and
ZFIN has permission only to display this image to its users.
Additional permissions should be obtained from the applicable author or publisher of the image.
Full text @ Biology (Basel)