- Title
-
Gata2-regulated Gfi1b expression controls endothelial programming during endothelial-to-hematopoietic transition
- Authors
- Koyunlar, C., Gioacchino, E., Vadgama, D., de Looper, H.W.J., Zink, J., Ter Borg, M., Hoogenboezem, R., Havermans, M., Sanders, M.A., Bindels, E., Dzierzak, E.A., Touw, I.P., de Pater, E.
- Source
- Full text @ Blood Adv
|
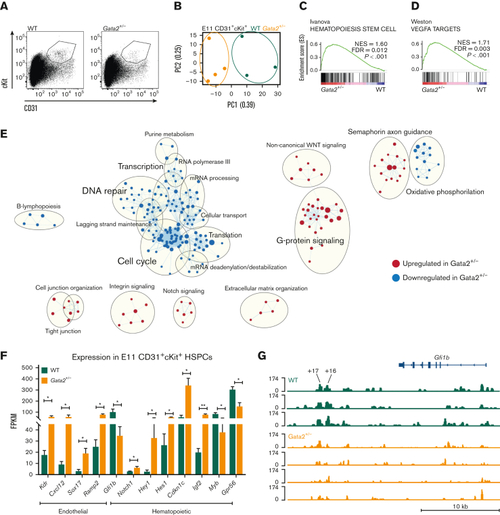
E11 Gata2+/− HSPCs exhibit aberrant hematopoietic and endothelial transcriptome. (A) Sorting strategy for CD31+cKit+ cells from E11 WT (left) or Gata2+/− (right) embryos. (B) PCA of the E11 WT (green) and Gata2+/− (orange) HSPCs. Dots represent the transcriptome of CD31+cKit+ cells from individual embryos (WT, n = 4; Gata2+/−, n = 3). Gene sets upregulated in Gata2+/− HSPCs compared with WT HSPCs in GSEA for Hematopoiesis stem cell (C) and Vegfa targets (D). (E) Network analysis comparing E11 WT and Gata2+/− HSPCs. Red dots show upregulated gene sets and blue dots show downregulated gene sets in Gata2+/− HSPCs compared with those in WT. (F) Comparison of the fragments per kilobase of exon per million fragments mapped (FPKM) values of endothelial (Kdr, Cxcl12, Sox17, and Ramp2) and hematopoietic (Gfi1b, Notch1, Hey1, Hes1, Cdkn1c, Igf2, Myb, and Gpr56)–specific genes between WT and Gata2+/− HSPCs. (G) Comparison of open chromatin between CD31+cKit+ cells isolated from individual E11 WT (N = 3, green) or Gata2+/− (N = 4, orange) embryos visualized using Integrative Genomics Viewer software. Accessible chromatin for Gfi1b and its +16 and +17 distal enhancer regions was analyzed. The peak range was set to minimum = 0 and maximum = 174 for all samples. The tool bar was 10 kb long. Error bars represent standard error of the mean. ∗P < .05, ∗∗P < .01. |
|
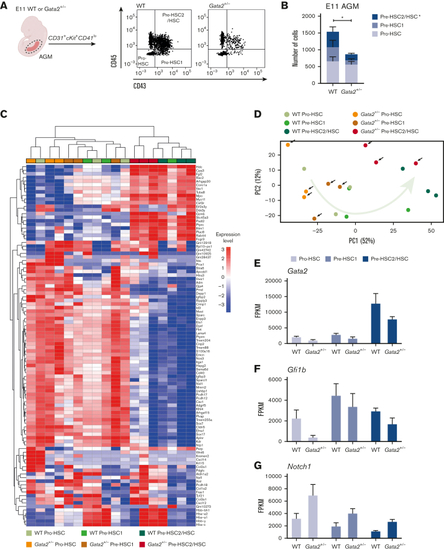
HSPC maturation within IAHCs is impaired in Gata2+/− during EHT. (A) Gating strategy to determine HSPC maturation of E11 WT and Gata2+/− AGMs. Representative images of pro-HSC, pre-HSC1, and pre-HSC2 gating obtained from the WT (left) or Gata2+/− (right) AGMs. (B) Quantification of the number of pro-HSC, pre-HSC1, and pre-HSC2 populations in E11 WT (n = 11) or Gata2+/− (n = 13) AGMs. (C) Unbiased heatmap of the transcriptomic signatures of pro-HSC, pre-HSC1, and pre-HSC2 populations from 3 independent E11 WT or 3 independent Gata2+/− AGMs. (D) PCA showing the transcriptome of each sample obtained by RNA sequencing. Black arrows indicate Gata2+/− samples. The green arrow indicates the maturation trajectory based on the transcriptome of WT HSPCs. FPKM values of Gata2 (E), Gfi1b (F), and Notch1 (G) depicted for each stage of maturation and compared between the WT and Gata2+/−. Error bars represent standard error of the mean. Color code for samples according to genotype: WT samples in the shades of green and Gata2+/− samples in the shades of orange. Color code for maturation steps: pro-HSCs, light gray; pre-HSC1, gray; pre-HSC2, dark blue. ∗P < .05. |
|
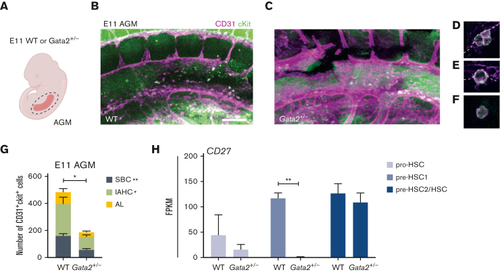
Both IAHCs and SBCs are depleted in Gata2+/− AGMs. (A) Illustration of the AGM region dissected for analysis of E11 WT or Gata2+/− embryos. Representative images of CD31+cKit+ cells obtained by confocal imaging of E11 WT AGM (B), Gata2+/− AGM (C), IAHCs (D), SBC (E), and aortic lumen (AL) (F) cell. Scale bars, 50 μm. (G) Quantification of CD31+cKit+ cells located in IAHCs, as SBCs, and AL cell within E11 WT (n = 3) and Gata2+/− (n = 4) AGMs. (H) FPKM values of CD27 depicted for each stage of the maturation and compared between WT and Gata2+/−. Error bars represent standard error of the mean. ∗P < .05, ∗∗P < .01. |
|
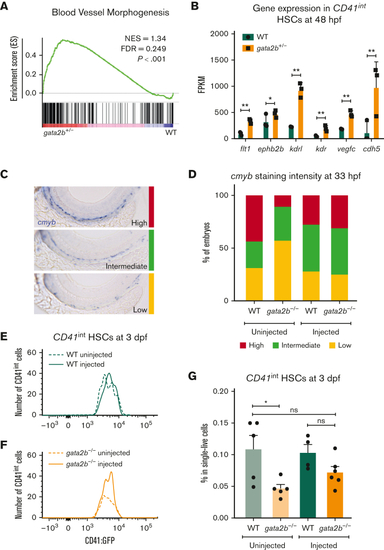
gfi1b induction restores the number of embryonic HSCs in gata2b−/− zebrafish. (A) Gene set enrichment plot depicting the expression of genes involved in blood vessel morphogenesis, highly enriched in gata2b+/−CD41int cells at 48 hpf compared with WT. (B) Expression data of endothelial markers from RNA sequencing results of CD41int HSCs of WT (green) and Gata2b+/− (orange) HSCs at 48 hpf in 3 biological replicates. Significance is shown as ∗adjusted P < .05 and ∗∗adjusted P < .001. (C) Representative images of 3 different staining intensities of cmyb whole-mount in situ expression detecting HSPCs along the dorsal aorta of 33 hpf zebrafish embryos. High cmyb expression is depicted in red, intermediate cmyb expression is depicted in green, and low cmyb expression is depicted in yellow. (D) Quantification of cmyb signal intensity analyzed at 33 hpf using ISH and compared between uninjected (WT, n = 2; gata2b−/−, n = 16) and injected (WT, n = 18; gata2b−/−, n = 16) WT and gata2b−/− embryos. Representative images of the number of CD41int HSCs compared between the uninjected (n = 5) and injected (n = 4) groups of WT (E), and uninjected (n = 5) and injected (n = 6) groups of gata2b−/− embryos (F). (G) The proportion of CD41int HSCs compared between the uninjected and injected groups of WT and gata2b−/− embryos. The dots represent individual samples and each sample contains 4 pooled embryos. dpf, days postfertilization; FACS, fluorescence-activated cell sorting; FDR, false discovery rate; GFP, green fluorescent protein; NES, normalized enrichment score. |


