
|
Fig. 3
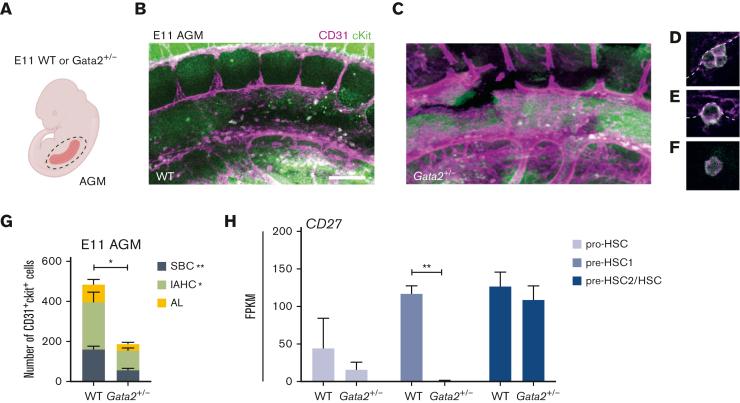
Both IAHCs and SBCs are depleted in Gata2+/− AGMs. (A) Illustration of the AGM region dissected for analysis of E11 WT or Gata2+/− embryos. Representative images of CD31+cKit+ cells obtained by confocal imaging of E11 WT AGM (B), Gata2+/− AGM (C), IAHCs (D), SBC (E), and aortic lumen (AL) (F) cell. Scale bars, 50 μm. (G) Quantification of CD31+cKit+ cells located in IAHCs, as SBCs, and AL cell within E11 WT (n = 3) and Gata2+/− (n = 4) AGMs. (H) FPKM values of CD27 depicted for each stage of the maturation and compared between WT and Gata2+/−. Error bars represent standard error of the mean. ∗P < .05, ∗∗P < .01.