Fig. 1
- ID
- ZDB-FIG-230920-5
- Publication
- Koyunlar et al., 2023 - Gata2-regulated Gfi1b expression controls endothelial programming during endothelial-to-hematopoietic transition
- Other Figures
- All Figure Page
- Back to All Figure Page
|
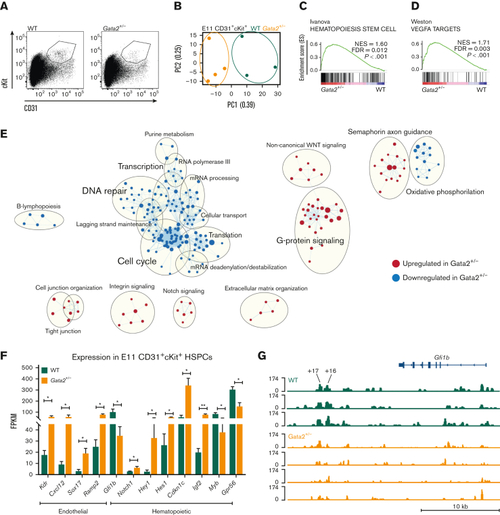
E11 Gata2+/− HSPCs exhibit aberrant hematopoietic and endothelial transcriptome. (A) Sorting strategy for CD31+cKit+ cells from E11 WT (left) or Gata2+/− (right) embryos. (B) PCA of the E11 WT (green) and Gata2+/− (orange) HSPCs. Dots represent the transcriptome of CD31+cKit+ cells from individual embryos (WT, n = 4; Gata2+/−, n = 3). Gene sets upregulated in Gata2+/− HSPCs compared with WT HSPCs in GSEA for Hematopoiesis stem cell (C) and Vegfa targets (D). (E) Network analysis comparing E11 WT and Gata2+/− HSPCs. Red dots show upregulated gene sets and blue dots show downregulated gene sets in Gata2+/− HSPCs compared with those in WT. (F) Comparison of the fragments per kilobase of exon per million fragments mapped (FPKM) values of endothelial (Kdr, Cxcl12, Sox17, and Ramp2) and hematopoietic (Gfi1b, Notch1, Hey1, Hes1, Cdkn1c, Igf2, Myb, and Gpr56)–specific genes between WT and Gata2+/− HSPCs. (G) Comparison of open chromatin between CD31+cKit+ cells isolated from individual E11 WT (N = 3, green) or Gata2+/− (N = 4, orange) embryos visualized using Integrative Genomics Viewer software. Accessible chromatin for Gfi1b and its +16 and +17 distal enhancer regions was analyzed. The peak range was set to minimum = 0 and maximum = 174 for all samples. The tool bar was 10 kb long. Error bars represent standard error of the mean. ∗P < .05, ∗∗P < .01. |

