- Title
-
Mechanics of the cellular microenvironment as probed by cells in vivo during zebrafish presomitic mesoderm differentiation
- Authors
- Mongera, A., Pochitaloff, M., Gustafson, H.J., Stooke-Vaughan, G.A., Rowghanian, P., Kim, S., Campàs, O.
- Source
- Full text @ Nat. Mater.
|
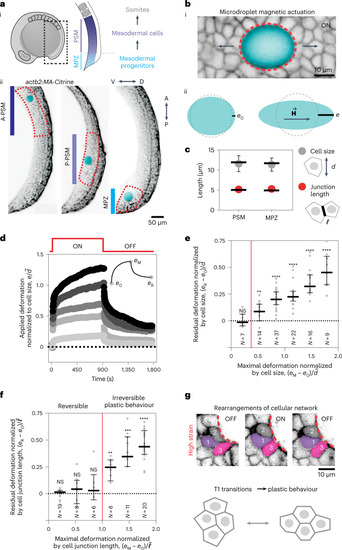
Junctional length establishes the onset of tissue plasticity.
a, Sketch showing a lateral view of a ten-somite stage embryo highlighting the posterior region of the body (dotted black rectangle) where mesodermal progenitors progressively differentiate as they transit from the MPZ to the PSM (i). Confocal sections along the sagittal plane of posterior extending tissues in membrane-labelled Tg(actb2:MA-Citrine) embryos (inverted) containing ferrofluid droplets (cyan) in different regions along the AP axis, namely the A-PSM, the posterior PSM (P-PSM) and the MPZ (ii). V, ventral; D, dorsal; A, anterior; P, posterior. The red dashed contours highlight each region (A-PSM, P-PSM and MPZ). b, Confocal section of droplet (cyan) during actuation (magnetic field ON; membrane label, inverted; i). Red dashed line indicates droplet contour and arrows indicate the direction of forces applied by the droplet. Sketches defining the induced droplet elongation e along the direction of the applied magnetic field Source data |
|
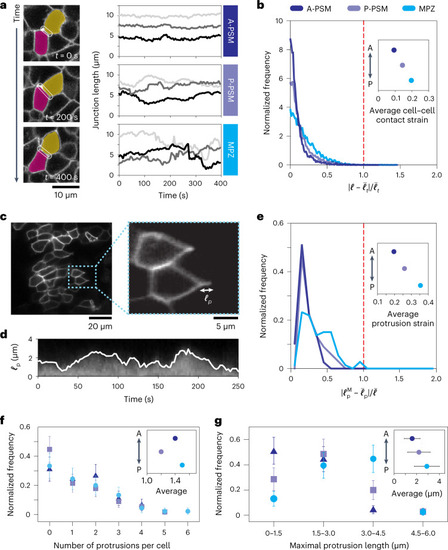
Cells endogenously probe the linear mechanics of the tissue.
a, Confocal sections showing the temporal changes in cell junction length (white outline) over 400 seconds, and time traces of junction length for cells in different regions of the tissue, showing that junction length is less variable in the A-PSM than in the MPZ. b, Normalized frequency (distribution) of the magnitude of relative variations in junction lengths Source data |
|
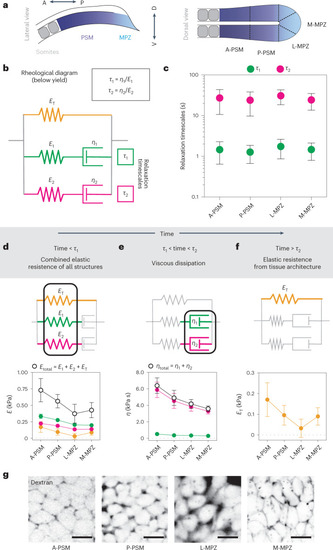
Characteristic timescales of endogenous mechanical probing of the cellular microenvironment.
a, Sketches of cell protrusions and cell–cell junctions, indicating the measured time-dependent protrusion length and cell–cell junctional length, Source data |
|
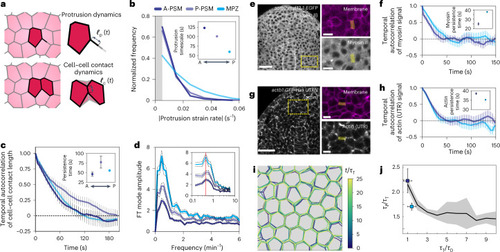
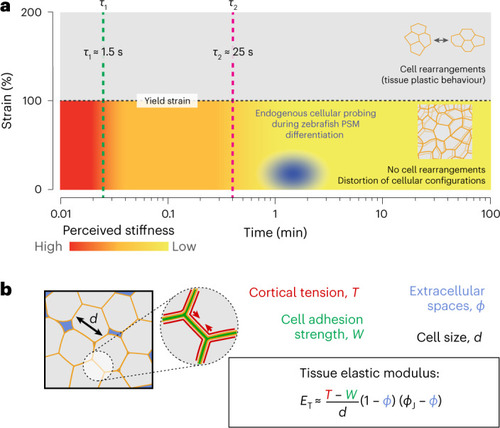
Cells probe the tissue stiffness associated with the local, foam-like architecture of the tissue.
a, Schematic representation of the measured mechanics of the microenvironment at different strains and timescales during PSM differentiation. The blue ellipse represents the region mechanically probed by cells in these tissues, as indicated by our measurements (for length scales of >0.5 μm and timescales of >1 s). Above the yield strain, cell rearrangements (T1 transitions, shown in the inset) occur, leading to plastic (irreversible) remodelling of the tissue architecture. Below yield, the tissue maintains its local cellular configurations (no cell rearrangements; inset) and dissipates stresses at different timescales, τ1 and τ2. The perceived microenvironment stiffness below yield (colour coded) decreases over time as stresses are dissipated, eventually reaching a constant low value (yellow) associated with the elasticity of deforming cellular packing configurations. Active cellular probing of the microenvironment (blue ellipse) occurs at timescales (~1–2 min) longer than all microenvironment relaxation timescales and at small strains (~10–30%), indicating that during PSM differentiation, cells probe the stiffness associated with the local, foam-like tissue architecture. b, Cortical tension, T, cell adhesion, W, and the volume fraction of extracellular spaces, ϕ, affect the stiffness, ET, of the foam-like tissue at supracellular scales for timescales larger than the measured relaxation timescales (~30 s) and smaller than those leading to substantial T1 transitions (~30 min). The equation shows this relationship (ϕJ being the jamming volume fraction for a disordered 3D foam), and the colours of the parameters in the equation correspond to the colours in the figure at the left. |

