FIGURE

Fig. 1

ID
ZDB-FIG-230606-1
Publication
Mongera et al., 2022 - Mechanics of the cellular microenvironment as probed by cells in vivo during zebrafish presomitic mesoderm differentiation
Other Figures
All Figure Page
Back to All Figure Page
Fig. 1

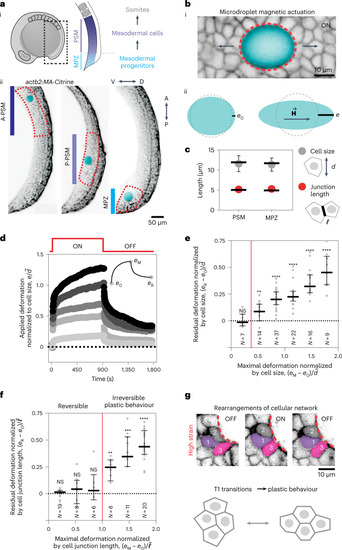
Junctional length establishes the onset of tissue plasticity.

a, Sketch showing a lateral view of a ten-somite stage embryo highlighting the posterior region of the body (dotted black rectangle) where mesodermal progenitors progressively differentiate as they transit from the MPZ to the PSM (i). Confocal sections along the sagittal plane of posterior extending tissues in membrane-labelled Tg(actb2:MA-Citrine) embryos (inverted) containing ferrofluid droplets (cyan) in different regions along the AP axis, namely the A-PSM, the posterior PSM (P-PSM) and the MPZ (ii). V, ventral; D, dorsal; A, anterior; P, posterior. The red dashed contours highlight each region (A-PSM, P-PSM and MPZ). b, Confocal section of droplet (cyan) during actuation (magnetic field ON; membrane label, inverted; i). Red dashed line indicates droplet contour and arrows indicate the direction of forces applied by the droplet. Sketches defining the induced droplet elongation e along the direction of the applied magnetic field H and the droplet pre-elongation before actuation, e0 (ii). Dashed lines indicate the unelongated droplet. c, Mean (dots) and median (lines) values of cell size (diameter, d; grey) and junctional length (β„“; red) in the MPZ and PSM, reanalysed from the literature27. The inset at the right shows illustrates the parameters. Error bars, s.e.m. d, Examples of the time evolution of droplet deformation (normalized droplet extension, 𝑒/π‘‘βŽ―βŽ―, where π‘‘βŽ―βŽ― is the average cell size (diameter); induced strain) during actuation cycles (OFF–ON–OFF) for different values of the applied magnetic field, leading to varying eM values. Both e0 and eR are defined in the inset. e,f, Residual droplet elongation normalized by average cell size, (𝑒Rβˆ’π‘’0)/π‘‘βŽ―βŽ― (e) or by average junctional length, (𝑒Rβˆ’π‘’0)/β„“βŽ―βŽ― (f), for varying values of the applied maximal droplet elongation (eM βˆ’ e0) normalized by average cell size (e) or junctional length (f) in the posterior paraxial mesoderm. Vertical red lines in e and f indicate the onset of plastic, irreversible deformation. Median and interquartile range are shown. P values were obtained from one-sample two-tailed t-tests. NS, not significant; **P = 0.0025, ****P < 0.0001. g, Snapshots showing confocal sections of tissue next to a droplet (dotted red line) during an actuation cycle (OFF–ON–OFF) causing T1 transitions that lead to plastic changes in the local tissue architecture (bottom).

Source data

Expression Data

Expression Detail
Antibody Labeling
Phenotype Data

Phenotype Detail
Acknowledgments
This image is the copyrighted work of the attributed author or publisher, and ZFIN has permission only to display this image to its users. Additional permissions should be obtained from the applicable author or publisher of the image. Full text @ Nat. Mater.