Figure Caption
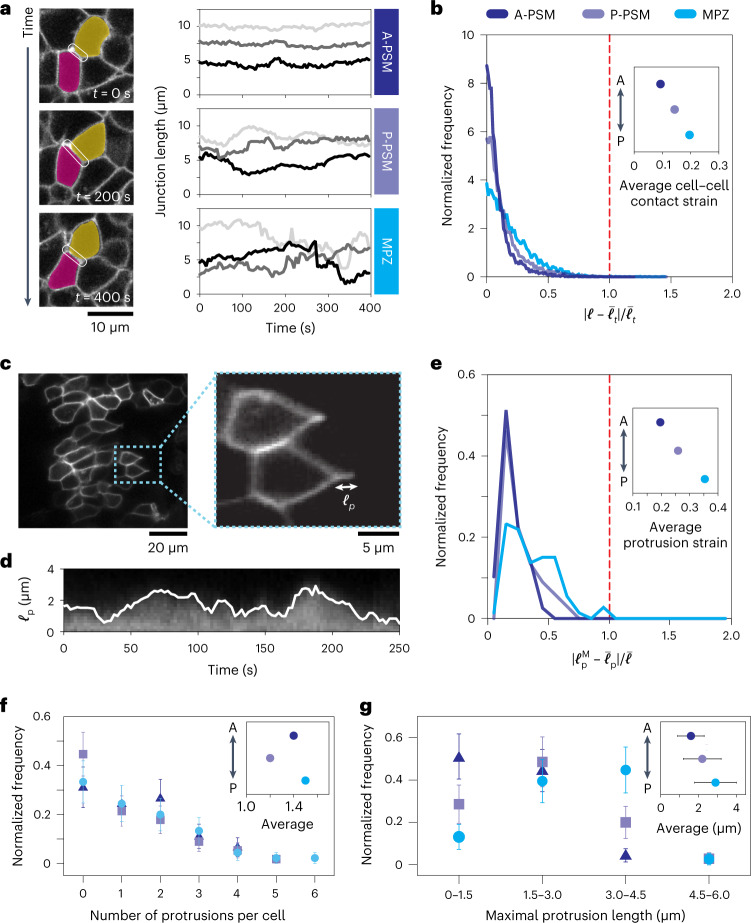
Cells endogenously probe the linear mechanics of the tissue.a, Confocal sections showing the temporal changes in cell junction length (white outline) over 400 seconds, and time traces of junction length for cells in different regions of the tissue, showing that junction length is less variable in the A-PSM than in the MPZ. b, Normalized frequency (distribution) of the magnitude of relative variations in junction lengths ∣∣ℓ−ℓ⎯⎯𝑡∣∣/ℓ⎯⎯𝑡 (endogenous applied strain at cell junctions) in the A-PSM and P-PSM (N of approximately 3,500 junctions in each region; four embryos), as well as the MPZ (N = 7,896; three embryos). The average endogenous applied strains at cell junctions (inset) are much smaller than the yield strain in the tissue (red dotted line). c, Confocal sections of PSM tissue in mosaic membrane-labelled embryos showing cell protrusions between cells. The length of each protrusion ℓp (inset) can be measured at each time point. d, Kymograph showing the fluorescence intensity along a protrusion path, enabling the determination of the time evolution of the protrusion length (white line), ℓp(𝑡). e, Normalized frequency of maximal protrusion strains ∣∣ℓMp−ℓ⎯⎯p∣∣/ℓ⎯⎯ in the different regions. Average protrusion strains (inset) are largest in the MPZ but much smaller than the yield strain in the tissue (red dotted line). Number of protrusions, N = 78 (A-PSM), 67 (P-PSM) or 73 (MPZ). f,g, Normalized frequency of the number of protrusions per cell (f) and their maximal lengths (g), with the average protrusion number per cell and average protrusion length shown in the insets of f and g, respectively. Mean ± s.d.; in f, number of cells N = 45 (A-PSM), 56 (P-PSM) or 45 (MPZ); number of protrusions N = 62 (A-PSM), 67 (P-PSM) or 66 (MPZ); in g, number of protrusions N = 45 (A-PSM), 35 (P-PSM) or 38 (MPZ).
Source data

