
- Title
-
Deconstructing body axis morphogenesis in zebrafish embryos using robot-assisted tissue micromanipulation
- Authors
- Özelçi, E., Mailand, E., Rüegg, M., Oates, A.C., Sakar, M.S.
- Source
- Full text @ Nat. Commun.
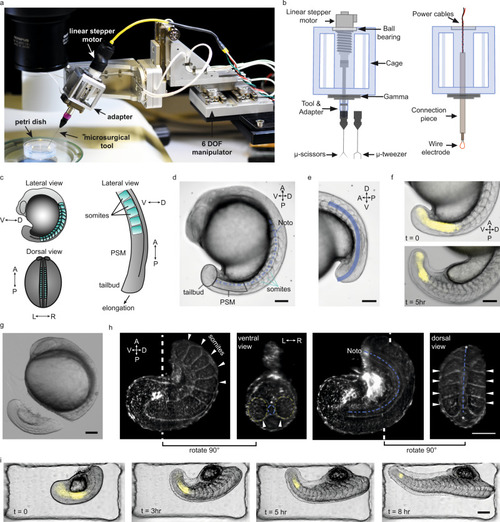
a Robotic tissue micromanipulation platform along with the stereo microscope and operation chamber. b Schematic illustration of the adapters designed to hold actuated and non-actuated instruments (not to scale). c Schematic showing the zebrafish embryo from different anatomical axes (V/D: ventral/dorsal, A/P: anterior/posterior, L/R: left/right). d A representative bright field (BF) image of a zebrafish embryo. Tissues that are studied in this work are indicated on the embryo. e Line of interest indicated with blue is generated to measure the AP tail length from BF image shown in (d). f Composite images of the embryo showing BF and Her1-YFP channels at different time points. g A BF image of the embryo right after robot-assisted microsurgery. h Light-sheet fluorescence image of a tail explant from a utr-mCherry transgenic line which marks filamentous actin structures. White dashed lines indicate the plane at which ventral and dorsal-view images were taken. White arrows indicate the somites, blue dashed-lines indicate notochord (Noto: notochord). i Composite images of a tail explant over time showing the elongation of the tail along with Her1-YFP signal. Scale bars, 100 μm. |

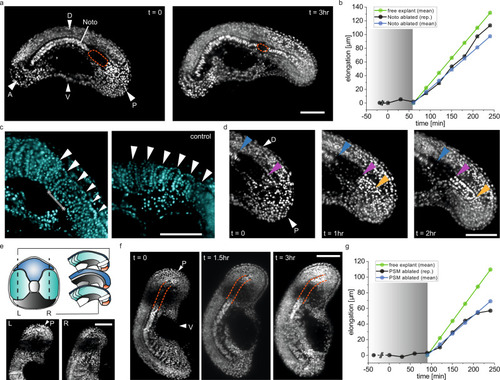
a Representative elongation vs time curves for in vivo embryos, and explants that are free to elongate or embedded inside agarose gel. b Elongation rates extracted from elongation vs time curves, such as shown in (a) (N = 4, n = 9 embryos, N = 4, n = 13 free explants, N = 3, n = 10 embedded explants). c Average period of somitogenesis in intact embryos (N = 4, n = 10), free tail explants (N = 4, n = 16), and embedded tail explants (N = 2, n = 7). d Average period of Her1-YFP oscillations in intact embryos (N = 4, n = 10), free tail explants (N = 4, n = 14), and embedded tail explants (N = 2, n = 7). e Representative plots showing the intensity of Her1-YFP signal over time. The signal is recorded in the anterior part of the intact embryos, free tail explant and embedded tail explants. f Schematic showing the tail explant embedded in 2% LMPA (low melting point agarose). Embedding leads to structural defects in the somites and the notochord (A: anterior, P: posterior). g, h Representative time-lapse BF images of a tail explant under confinement. Orange arrows indicate the location of buckling of the notochord. (g) shows the length measurement based on the anterior and posterior ends of the tail explant, termed tail elongation. h The length measurement based on the notochord of the tail explant, termed notochord elongation. i Elongation rates of the embedded tail explant (emb. tail) (N = 3, n = 10), notochord of the embedded tail explant (emb. Noto) (N = 3, n = 10), and the elongation rate of the notochord of the free explant (free Noto) (N = 4, n = 13). j Representative time-lapse fluorescence images of tail explants expressing H2B-mCherry. Orange arrows indicate the location and progression of buckling of the notochord. Scale bars, 100 μm. Box plots in panels (b), (c), (d) and (i) indicate the median (mid-line), 25th and 75th percentiles (box), and 1.5× the interquartile range (whiskers). All statistical comparisons are performed with one way ANOVA test, ***P < 0.001, n.s. indicates not significant. |

a Schematic showing the dissection of the tail explant into an anterior (explant-A) and a posterior (explant-P) piece. Right schematic shows the main structures we focus on in this paper for explant-A and -P (A: anterior, P: posterior, Noto: notochord, a/pPSM: anterior/posterior PSM). b Composite image of BF and YFP channels showing the elongation and Her1-YFP expression in explant-A and explant-P cut from the same tail explant. A and P are placed on the top left image to indicate the anterior and posterior of the entire explant. Scale bar, 100 µm. c Elongation rates of the explant-A (N = 4, n = 8), explant-P (N = 4, n = 10), the sum of the elongation rates of explant-A and explant-P (summed) (N = 4, n = 7) and the intact tail explant (N = 4, n = 13). Box plots indicate the median (mid-line), 25th and 75th percentiles (box), and 1.5× the interquartile range (whiskers). Statistical comparisons are performed with One Way ANOVA test for which ***P < 0.001, **P < 0.01, n.s. indicates not significant. P = 0.002 for the comparison between explant-P and summed. d Intensity of Her1-YFP signal in the anterior part of explant-A and explant-P. Grey and yellow shaded regions respectively indicate the time interval where the anterior and posterior explant pieces are segmenting. |
a Time-lapse fluorescence images of a H2B-mCherry tail explant in which the posterior end of the notochord is ablated using laser microsurgery. Ablated region is indicated with the orange dashed line (Noto: notochord, A/P: anterior/posterior, D/V: dorsal/ventral). b The elongation of the tail over time for the explant shown in (a). Grey shaded part indicates the period during which the elongation process is affected. Time passed from ablation until the start of the movie is indicated before t = 0 with dashed line (free explant N = 4, n = 13, Noto ablated explant N = 5, n = 10). c Somites formed next to the ablated notochord region (highlighted with the line in between asterisks) are malformed. White arrows indicate the somites. d Time-lapse fluorescence images of the ablated notochord region show the elongation of the notochord at the tip. Blue, purple and yellow arrows indicate the anterior and posterior ends of the ablated region and the posterior most end of the elongating notochord respectively. e (top) Schematic showing the right and left part of the tail explant that are ablated from the mediolateral and anteroposterior views (L/R: left/right, P: posterior). (bottom) Fluorescence images showing the ablated regions of both sides of the PSM. f Time-lapse fluorescence images of a tail explant where both sides of the posterior PSM are ablated. Orange dashed lines are to see the notochord easily. g Tail elongation curve of the explant shown in (f). Grey shaded part indicates the period during which the elongation process is affected. Time passed from ablation until the start of the movie is indicated before t = 0 with dashed line (free explant N = 4, n = 13, PSM ablated explant N = 5, n = 11). Scale bars, 100 μm. |
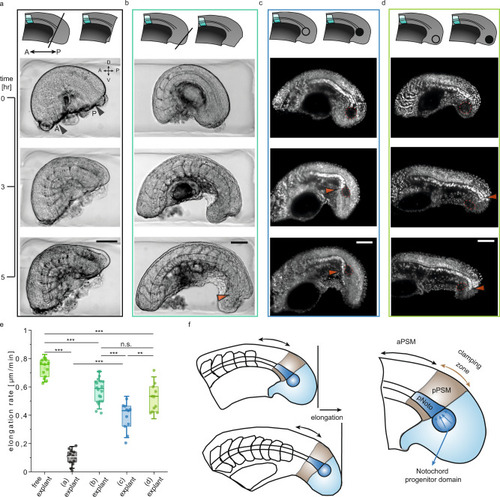
Schematics describing the micromanipulations are shown at the top of each case. a Time-lapse BF images of a tail explant where the tail bud is removed using the microcautery device (A/P: anterior/posterior, D/V: dorsal/ventral). b Time-lapse BF images of a tail explant where the tip of the tail bud is removed using the electrocautery device. Orange arrow shows the location towards which the notochord elongates. The notochord progenitor domain is maintained intact. c Time-lapse fluorescence images of a H2B-mCherry labelled tail explant where the notochord progenitor domain is ablated using laser microsurgery. Orange arrow shows the location where the notochord bends towards the ventral side of the tail. d Time-lapse fluorescence images of a H2B-mCherry labelled tail explant where the tip of the tailbud is ablated. e Elongation rate of the free explants (N = 4, n = 13) and explant samples presented in (a) (N = 4, n = 14), b (N = 6, n = 20), c (N = 5, n = 11), d (N = 5, n = 11). Box plots indicate the median (mid-line), 25th and 75th percentiles (box), and 1.5× the interquartile range (whiskers). Statistical comparisons are performed with one way ANOVA test for which ***P < 0.001, **P < 0.01, n.s. indicates not significant. P = 0.004 for the comparison between (c) explant and (d) explant. f Mechanism of the tail elongation in observed stages. Key players are named and coloured ((p)Noto: (posterior)notochord, a/pPSM: anterior/posterior PSM). Clamping zone refers to the posterior part of the tail where the notochord is held in position. Scale bars, 100 μm. |