
Fig. 3
- ID
- ZDB-IMAGE-221226-185
- Publication
- Özelçi et al., 2022 - Deconstructing body axis morphogenesis in zebrafish embryos using robot-assisted tissue micromanipulation
- All Figures
- Figures for Özelçi et al., 2022
|
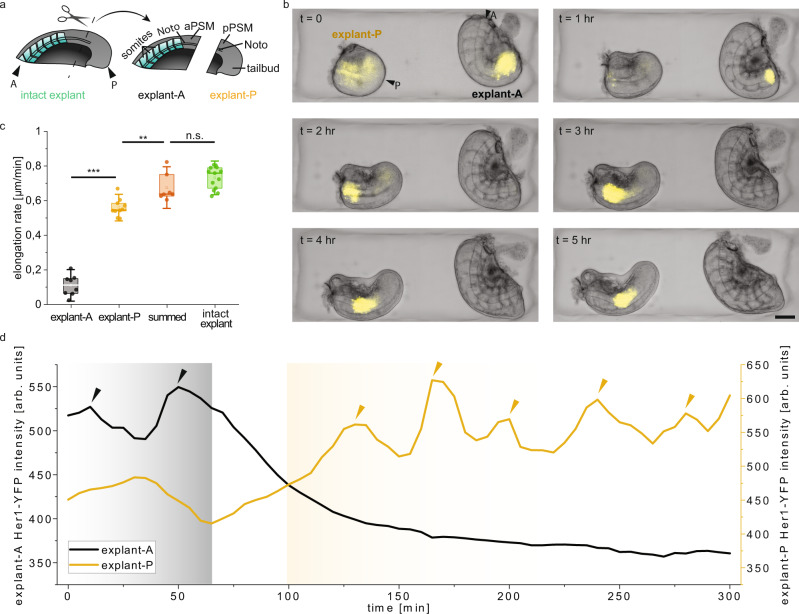
Fig. 3 a Schematic showing the dissection of the tail explant into an anterior (explant-A) and a posterior (explant-P) piece. Right schematic shows the main structures we focus on in this paper for explant-A and -P (A: anterior, P: posterior, Noto: notochord, a/pPSM: anterior/posterior PSM). b Composite image of BF and YFP channels showing the elongation and Her1-YFP expression in explant-A and explant-P cut from the same tail explant. A and P are placed on the top left image to indicate the anterior and posterior of the entire explant. Scale bar, 100 µm. c Elongation rates of the explant-A (N = 4, n = 8), explant-P (N = 4, n = 10), the sum of the elongation rates of explant-A and explant-P (summed) (N = 4, n = 7) and the intact tail explant (N = 4, n = 13). Box plots indicate the median (mid-line), 25th and 75th percentiles (box), and 1.5× the interquartile range (whiskers). Statistical comparisons are performed with One Way ANOVA test for which ***P < 0.001, **P < 0.01, n.s. indicates not significant. P = 0.002 for the comparison between explant-P and summed. d Intensity of Her1-YFP signal in the anterior part of explant-A and explant-P. Grey and yellow shaded regions respectively indicate the time interval where the anterior and posterior explant pieces are segmenting.