
- Title
-
YB-1 regulates mesothelioma cell migration via Snail but not EGFR, MMP1, EPHA5 or PARK2
- Authors
- Schelch, K., Eder, S., Zitta, B., Phimmachanh, M., Johnson, T.G., Emminger, D., Wenninger-Weinzierl, A., Sturtzel, C., Poplimont, H., Ries, A., Hoetzenecker, K., Hoda, M.A., Berger, W., Distel, M., Dome, B., Reid, G., Grusch, M.
- Source
- Full text @ Mol. Oncol.
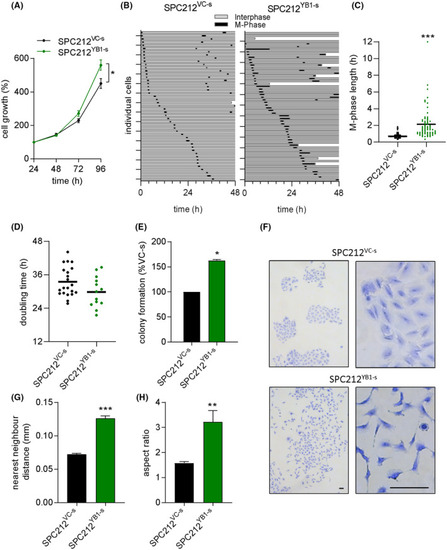
YB‐1 overexpression induces cell cycle alterations, scattering and morphology changes. (A) Cell growth of SPC212 cells stably overexpressing YB‐1 (SPC212YB1‐s) or the empty vector (SPC212VC‐s) after 96 h. Data are shown as mean ± SEM of 3 biological replicates performed in triplicate. (B) Cells were subjected to videomicroscopy over 48 h with 10 min intervals. Cell fate maps indicate interphase (gray) and M‐phase duration (black). Cells that died over the 48‐h period are indicated by the bar not reaching the end of the graph. Each bar represents one single cell. (C) M‐phase lengths and (D) doubling times of single cells from videos in (B). Each dot represents one single cell. The horizontal lines indicate the mean. (E) Quantification of colony formation assays. (F) Representative pictures of colony formation assays. Scale bar: 100 μm. (G) Distance to the nearest neighbor of > 160 cells and (H) aspect ratio of > 20 single cells, derived from colony formation assays. Bars show mean ± SEM. Student's |
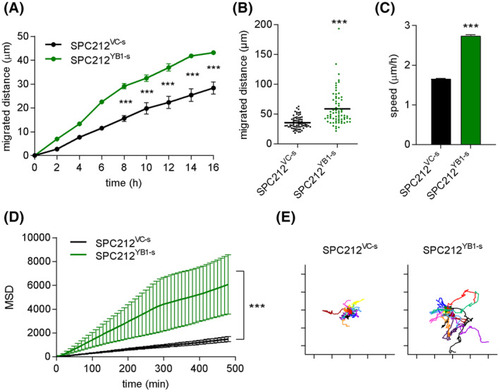
YB‐1 overexpression increases cell migration. (A) Migrated distance of SPC212 cells stably overexpressing YB‐1 (SPC212YB1‐s) or the empty vector (SPC212VC‐s) in wound healing assays. Data is shown as mean ± SEM of three biological replicates. (B) Cumulative migrated distance of single cells over 24 h, quantified by manual single cell tracking. Each dot represents one single cell. The horizontal lines indicate the mean. (C) Average speed, (D) mean squared displacement (MSD) and (E) origin plots of tracked cells ( |
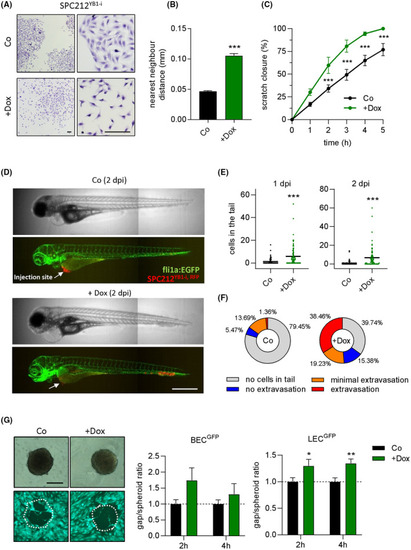
Doxycycline‐inducible YB‐1 overexpression increases cell migration. (A) Representative pictures of SPC212YB1‐i cells in a colony formation assay, with or without 100 ng·mL−1 doxycycline (dox, Co). Scale bar: 100 μm. Experiments were performed twice in triplicates. (B) Distance to the nearest neighbor of > 120 cells derived from colony formation assays. Data are shown as mean ± SEM. (C) Percentage of wound closure in a wound healing assay with or without 100 ng·mL−1 doxycycline (dox). Data are shown as mean ± SEM of 4 biological replicates. (D) Representative pictures of fli1a:EGFP transgenic zebrafish without (Co) and with 100 μg·mL−1 doxycycline (+dox) 2 days post injection (dpi) with SPC212YB1‐I,RFP cells. The injection site is indicated by the white arrow. Scale bar: 500 μm. Experiments were performed twice. (E) Quantification of tumor cells present in the tail treated as indicated after 1 and 2 dpi. Each dot represents one fish. The horizontal lines indicate the mean. (F) Percentage of fish ( |

YB‐1 levels directly affect PM cell migration. Cells were transfected with 5 nM of si‐YB1CDS (si‐CDS), si‐YB1UTR (si‐UTR) or control siRNA (Co) and on the next day treated with 100 ng·mL−1 doxycycline (+dox). (A) Log2 fold change of |

YB‐1 regulates the expression of EGFR and snail. Expression levels of target gene mRNA 48 h after transfection with 5 n |

Snail but not EGFR inhibition prevents YB‐1‐induced PM cell migration. (A) Cells were exposed to 10 μ |