
- Title
-
Primordial germ cells adjust their protrusion type while migrating in different tissue contexts in vivo
- Authors
- Truszkowski, L., Batur, D., Long, H., Tarbashevich, K., Vos, B.E., Trappmann, B., Raz, E.
- Source
- Full text @ Development
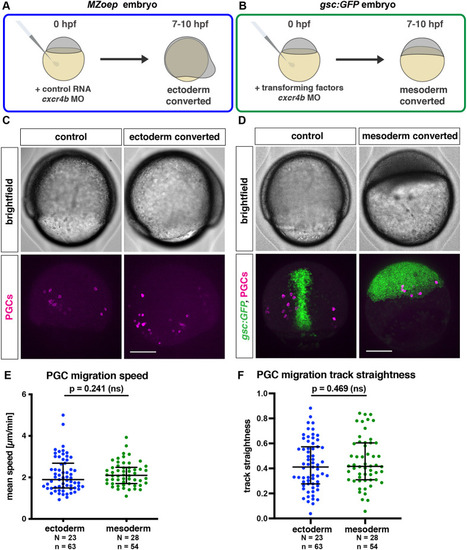
Migration of PGCs within ectodermal and mesodermal tissues. (A) Schematic depiction of the generation of embryos composed of ectodermal cells. In maternal-zygotic one eye pinhead mutant embryos (MZoep), all the somatic cells develop into ectoderm, with Cxcr4b expression inhibited by injection of cxcr4b morpholino. (B) Conversion of embryonic cells into mesoderm is achieved by co-injection of RNA encoding a Nodal ligand (cyclops) and a morpholino directed against the RNA encoding the transcription factor Sox32 (together referred to as ‘transforming factors’). (C) Lateral views of control and ectoderm-converted embryos (upper panels), with the PGCs labeled (magenta, lower panels). (D) Dorsal views showing control and mesoderm-converted embryos (upper panels) with the PGCs labeled (magenta) and the expression of GFP driven by the goosecoid promoter (green) in the corresponding embryos (lower panels). Scale bars: 200 µm. (E,F) Migration speed (E) and track straightness (F) of PGCs migrating within ectodermal and mesodermal tissues. The graphs show the median; whiskers indicate the interquartile range (IQR). For speed comparison (E), a Mann–Whitney test was performed; for straightness comparison (F), a two-tailed t-test was performed. N and n represent numbers of embryos and cells, respectively. |
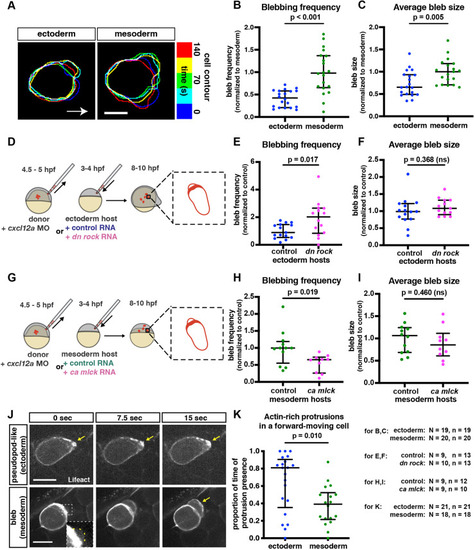
Alterations in protrusive behavior in PGCs located within different environments. (A) Overlay of cell contours over time of representative PGCs migrating in ectodermal and mesodermal tissues. Contours were aligned to the back of the cell to correct for forward movement. Arrow indicates the direction of migration. Scale bar: 10 µm. (B,C) Blebbing frequency (B) and average bleb size (C) of PGCs moving within converted embryos. For bleb frequency comparison (B), a Mann–Whitney test was performed; for average bleb size (C), a two-tailed t-test was performed. (D) The PGC transplantation experiment scheme. Labeled wild-type PGCs were transplanted into ectoderm-converted embryos that were injected at the one-cell stage with either control RNA or a dominant-negative form of ROCK. 4 to 6 h later, blebs formed by the transplanted PGCs were analyzed. (G) A similar transplantation was performed into mesoderm-converted embryos that expressed either control RNA or RNA encoding a constitutively active form of MLCK. (E,F,H,I) Bleb formation frequency (E,H) and average bleb size (F,I) produced by PGCs transplanted into the different environments. Two-tailed t-tests were performed. (J) Snapshots of migrating PGCs. Arrows indicate actin enrichment at the edge of protrusion. Inset shows a zoomed-in, contrast-adjusted view of the early-stage bleb, with a yellow dashed line outlining the bleb contour. Scale bars: 15 µm. (K) The proportion of time actin-rich protrusions that are present at the front of a forward-moving cell. Mann–Whitney test was used. The graphs show the median; whiskers indicate the interquartile range (IQR). N and n at the bottom right represent numbers of embryos and cells, respectively. |

The role of Rho GTPases in controlling protrusion type formation. (A,B) Normalized whole-cell FRET-based activity measurement of RhoA (A) and Rac1 (B). The graphs show the median; whiskers indicate the interquartile range (IQR). A two-tailed t-test was used in A; a Mann-Whitney test was used in B. Scale bars: 15 μm. (C) Normalized whole cell FRET-based myosin light chain phosphorylation levels. The graph shows the median; whiskers indicate the interquartile range (IQR). Two-tailed t-test was performed. (D) Representative images of actin flow in PGCs migrating within ectodermal and mesodermal tissues. Kymographs derived from the middle of the cell. Scale bar: 15 µm. (E) Retrograde actin flow speed (V). The graph shows the median; whiskers indicate the interquartile range (IQR). Two tailed t-test was performed. (F,H) Representative examples of ezrin-YPet distribution in PGCs residing within converted embryos (F) or in PGCs expressing control RNA or low levels of RNA encoding a constitutively active form of RhoA (H). Scale bars: 15 µm. (G,I) Schematic representation of cortical ezrin distribution around the cell perimeter (left). Cortical ezrin signal was masked and sliced in an angular manner, and the results are presented in the graphs. For each cell, ezrin intensity was normalized to the peak intensity in the cell. Colored dots and solid lines represent the means; dashed lines represent the standard deviations. A Kolmogorov–Smirnov test was performed to compare frequency distributions. N and n represent numbers of embryos and cells, respectively. |
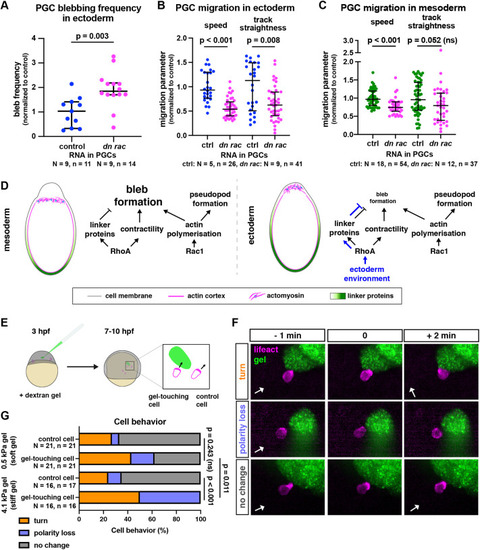
Effect of blebbing and physical barriers on PGC migration and polarity. (A) Blebbing frequency in PGCs that reside within ectodermal tissues and express control RNA or RNA encoding a dominant-negative version of Rac1. A two-tailed t-test was performed. (B,C) Speed and track straightness of PGCs expressing control RNA or a dominant-negative version of Rac1, migrating among converted ectodermal cells (B) or mesodermal cells (C). A Mann–Whitney test was performed for track straightness comparison in B and both comparisons in C, a two-tailed t-test was performed for speed comparison in B. The graphs show the median; whiskers indicate the interquartile range (IQR) (D) A model illustrating molecular interactions that lead to the protrusion-type shift in different environments. (E) Illustration of the gel injection experiment. Mutant cxcr4b−/− embryos were injected with a dextran gel of 0.5 kPa or 4.1 kPa stiffness at 3 hpf and were imaged 4 h later. As cells migrate non-directionally, some stochastically come in contact with the gel (left cell right-hand box). Alterations in actin distribution were then monitored in cells that came into contact with the gel and in neighboring PGCs that did not encounter the gel (right cell in magnified box). The comparison between the PGCs was performed to control for the inherent periodic loss of polarity observed in PGCs (tumbling; Reichman-Fried et al., 2004). (F) Examples of the reactions of PGCs (lifeact in magenta) to the gel (green). Behaviors were scored based on the change in the polarity of the actin-rich front. The white arrows indicate the direction of the back-front axis of the cell before the interaction with the gel. (G) Quantification of cell behaviors. For statistical tests, Fisher's exact test was performed (comparing the combined turn and loss of polarity behaviors to no change in polarity). A Bonferroni correction for multiple testing was applied. N and n represent numbers of embryos and cells, respectively. |