
|
Fig. 1.
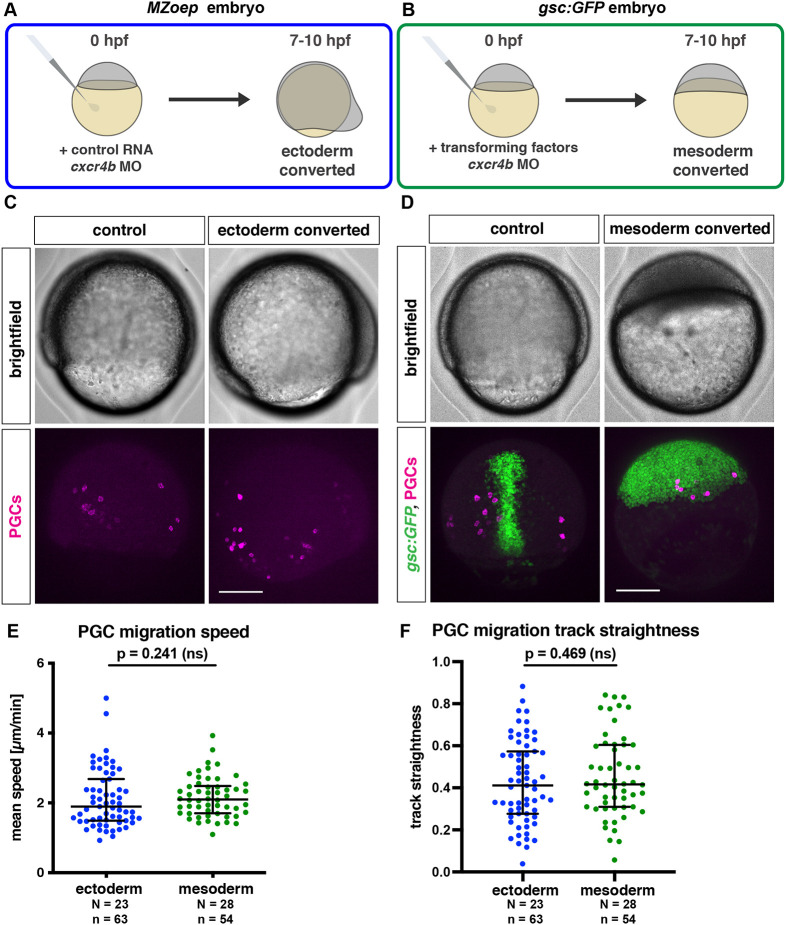
Migration of PGCs within ectodermal and mesodermal tissues. (A) Schematic depiction of the generation of embryos composed of ectodermal cells. In maternal-zygotic one eye pinhead mutant embryos (MZoep), all the somatic cells develop into ectoderm, with Cxcr4b expression inhibited by injection of cxcr4b morpholino. (B) Conversion of embryonic cells into mesoderm is achieved by co-injection of RNA encoding a Nodal ligand (cyclops) and a morpholino directed against the RNA encoding the transcription factor Sox32 (together referred to as ‘transforming factors’). (C) Lateral views of control and ectoderm-converted embryos (upper panels), with the PGCs labeled (magenta, lower panels). (D) Dorsal views showing control and mesoderm-converted embryos (upper panels) with the PGCs labeled (magenta) and the expression of GFP driven by the goosecoid promoter (green) in the corresponding embryos (lower panels). Scale bars: 200 µm. (E,F) Migration speed (E) and track straightness (F) of PGCs migrating within ectodermal and mesodermal tissues. The graphs show the median; whiskers indicate the interquartile range (IQR). For speed comparison (E), a Mann–Whitney test was performed; for straightness comparison (F), a two-tailed t-test was performed. N and n represent numbers of embryos and cells, respectively.