FIGURE SUMMARY
Title

Evaluation of Cisplatin-Induced Pathology in the Larval Zebrafish Lateral Line

Authors
Lee, D.S., Schrader, A., Bell, E., Warchol, M.E., Sheets, L.
Source
Full text @ Int. J. Mol. Sci.

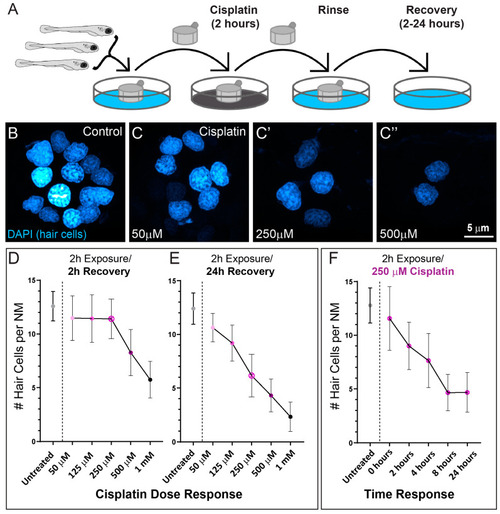
Dose- and time- response relationships of lateral line hair cell loss following 2 h exposure to cisplatin. (A) Diagram of standardized larval zebrafish cisplatin exposure protocol. Larvae (6 dpf) were placed into cell strainers and moved between cisplatin exposure and EM rinse steps, while being allowed to swim freely in EM during recovery. (B,C) Maximum intensity projection images of neuromast hair cell nuclei labeled with DAPI in either control (B) or cisplatin-treated (CC”) larvae following 24 h recovery. (D,E) Cisplatin dose response relationship of hair cell loss per neuromast following either 2 h (D) or 24 h (E) recovery. Each dot represents the mean number of hair cells from 47–50 neuromasts/3 experimental trials. Note the delay in maximal hair cell loss at all doses examined. (F) Time response relationship following exposure to 250 µM cisplatin. Each dot represents the mean number of hair cells from 16–20 neuromasts. Maximal hair cell loss appeared to occur between 4–8 h following cisplatin exposure. Bars = SD.

Macrophages respond to cisplatin-induced injury and phagocytose dying hair cells. (AD) Single z-section images taken from 15 µm-depth confocal stacks of neuromasts in fish following treatment with 250 µM cisplatin. Macrophages are labeled with YFP (cyan), hair cells with an antibody to Otoferlin (HCS-1; yellow) and all cell nuclei are labeled with DAPI (blue). Arrows indicate macrophage phagocytosis of dying hair cells. Note that the macrophages at 2- and 4-h recovery (A,B) have internalized otoferlin-labeled hair cell debris (yellow) as well as pyknotic nuclei (blue). At later time points (C,D) macrophages are in proximity of neuromasts but no longer phagocytosing hair cell debris (E,F). Quantification of macrophages in proximity to neuromasts (E) and contacting neuromasts (F) following cisplatin. There was no observed difference between cisplatin treated and control. (G) Quantification of phagocytotic events in cisplatin treated neuromasts, which peaked 4 h post cisplatin treatment (Dunn’s multiple comparisons test, ** adjusted p = 0.0636). Bars = SD. Data obtained from 10–14 fish/treatment group.

Depleting macrophages does not affect cisplatin induced neuromast hair cell loss. (AC) Selective depletion of macrophages in double transgenic fish (gl25Tg, Tg(mpeg1.1:GAL4FF); c264Tg, Tg(UAS-E1B:NTR-mCherry). (A,B) Representative images of macrophage distribution (indicated with arrows) within the posterior-most 500 µm of the spinal column of fish treated with for 24 h with 0.1% DMSO (A) or 10 mM MTZ (B). (C) MTZ-treated fish showed a significant depletion of macrophages relative to DMSO-treated control (Unpaired t-test; **** p < 0.0001). Bars = Mean w/95% CI. Data obtained from 16 fish/treatment group. (D,E) Single z-section images taken from confocal stacks of neuromasts in fish following treatment with 250 µM cisplatin. Macrophages are labeled with YFP (cyan), hair cells with an antibody to Otoferlin (HCS-1; yellow) and all cell nuclei are labeled with DAPI (blue). (F) Quantification of hair cell loss following exposure to 250 µM cisplatin and 24 h recovery. Significant hair cell loss following cisplatin was observed in both DMSO and MTZ treatment groups relative to controls (Tukey’s multiple comparisons test, **** adjusted p < 0.0001), but no difference in cisplatin-induced hair cell loss was observed between DMSO and MTX treatment groups (adjusted p = 0.6415) Bars = Mean w/95% CI. n = 37–39 fish per treatment group, N = 3 trials.

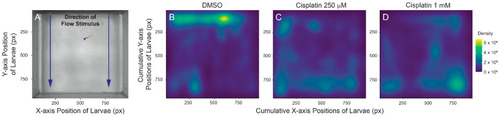
Cisplatin impairs larval ability to station hold in the presence of flow stimulus. (A) Top-down view of microflume with overlaying Cartesian coordinate system. Blue arrows indicate direction of water flow. Zero on the y axis indicates area of microflume with the strongest flow. Fish included for scale. (BD) Two-dimensional spatial heat maps of cumulative positioning during flow stimulus indicate that lesioned fish accumulate towards the back of the microflume while DMSO-treated fish successfully station hold against current. n = 8–10 fish. N = 6 trials.

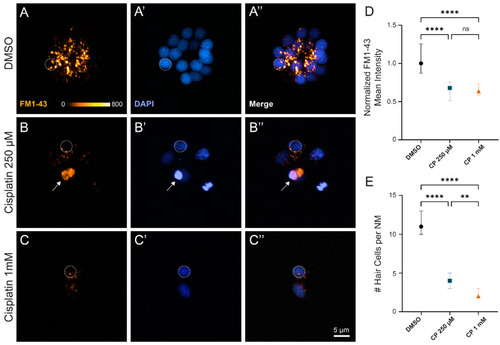
Surviving neuromast hair cells after cisplatin treatment demonstrate impaired mechanotransduction. (AC) Maximum-intensity projections of confocal images show wildtype zebrafish neuromasts after 2 h treatment with 0.1% DMSO (A), 250 µM cisplatin (B), and 1 mM cisplatin (C) followed by a 24 h recovery in EM. Dotted circles exemplify 4 µm region of interest used to measure mean FM1-43 intensity. Arrow indicates non-viable hair cell that was not included in analysis (B). Mean hair cell FM1-43 intensity (normalized to control) demonstrates decreased mechanotransduction among cisplatin-treated fish compared to those exposed to vehicle control ((D), **** p < 0.0001, Kruskal–Wallis test). Post hoc analysis with Dunnett’s multiple comparisons test failed to detect significant changes in FM1-43 uptake between moderate and high dose cisplatin ((D), ns > 0.9999). Cisplatin demonstrates a dose-dependent increase in hair cell loss ((E), **** p < 0.0001, ** p = 0.0069; Dunnett’s multiple comparisons test). Median values with corresponding 95% confidence intervals shown for both FM1-43 uptake and hair cell counts. n = 3–4 fish (2–3 neuromasts per fish). N = 3 trials.

Acknowledgments
This image is the copyrighted work of the attributed author or publisher, and ZFIN has permission only to display this image to its users. Additional permissions should be obtained from the applicable author or publisher of the image. Full text @ Int. J. Mol. Sci.