
- Title
-
The RNA demethylase ALKBH5 promotes the progression and angiogenesis of lung cancer by regulating the stability of the LncRNA PVT1
- Authors
- Shen, W., Pu, J., Zuo, Z., Gu, S., Sun, J., Tan, B., Wang, L., Cheng, J., Zuo, Y.
- Source
- Full text @ Cancer Cell Int.
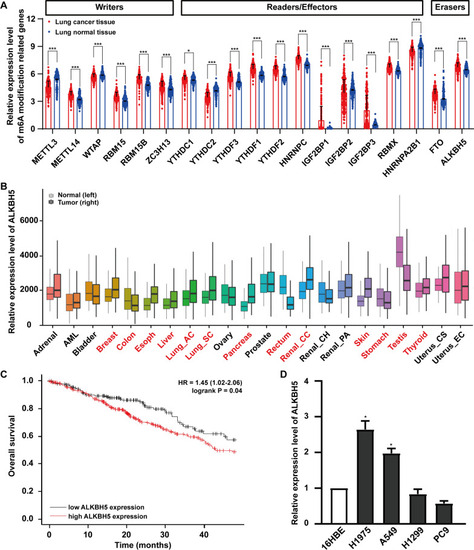
ALKBH5 is upregulated in lung cancer tissues and associated with poor prognosis. A The expression levels of m6A modification-related genes in lung cancer tissues and normal tissues obtained by analyzing the TCGA database and GTEx database. B ALKBH5 expression in different tumors was analyzed using the TNM plot website. Tumors in red represent significant differences in expression levels between tumors and normal tissues. C Kaplan‒Meier analysis was used to show the correlation between ALKBH5 expression levels and overall survival of patients with lung cancer. D The expression of ALKBH5 was measured by qRT‒PCR in four lung cancer cell lines (A549, H1299, H1975, PC9) compared with the human bronchial epithelial cell 16HBE. *: P < 0.05, ***: P < 0.001 |
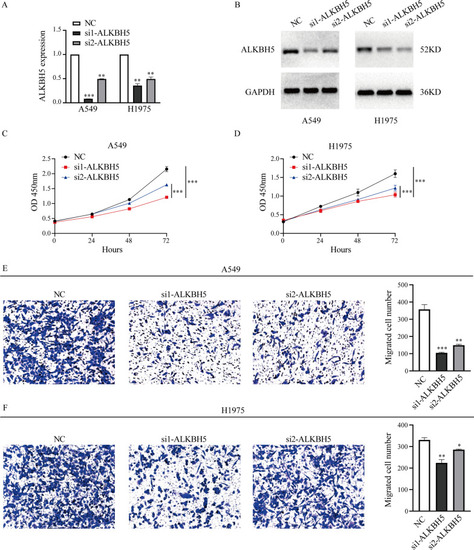
Knockdown of ALKBH5 inhibits the proliferation and migration of lung cancer cells in vitro. A The knockdown efficiency in A549 and H1975 cells after transfection with ALKBH5 siRNAs or NC as shown by qRT‒PCR. B The protein expression level of ALKBH5 was detected in A549 and H1975 cells by western blot after transfection with ALKBH5 siRNAs or NC. C, D CCK-8 assays were performed to evaluate the proliferation of A549 and H1975 cells after knocking down ALKBH5. E, F Transwell assays were performed to evaluate migration in A549 and H1975 cells after knocking down ALKBH5. *: P < 0.05, **: P < 0.01, ***: P < 0.001 |
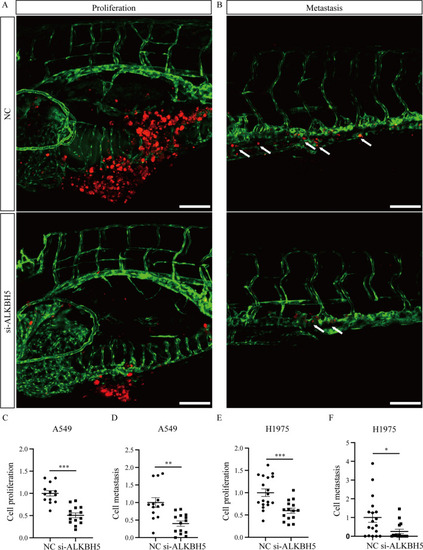
Knockdown of ALKBH5 inhibits the proliferation and metastasis of lung cancer cells in vivo. A, B The CM-DiI-positive signals in the yolk and trunk of zebrafish were imaged by confocal microscopy at 4 days postinjection of A549 cells transfected with si-ALKBH5 or NC. The red signals indicate the cancer cells labeled CM-DiI. The green signals indicate the blood vessels that expressed EGFP. The white arrows represent the metastatic cells. Scale bar: 100 μm. C, D Statistical analysis of the proliferation and metastasis of A549 cells after knockdown of ALKBH5. NC: n = 13, si-ALKBH5: n = 14. E, F Statistical analysis of the proliferation and metastasis of H1975 cells after knockdown of ALKBH5. NC: n = 13, si-ALKBH5: n = 14. *: P < 0.05, **: P < 0.01, ***: P < 0.001 |
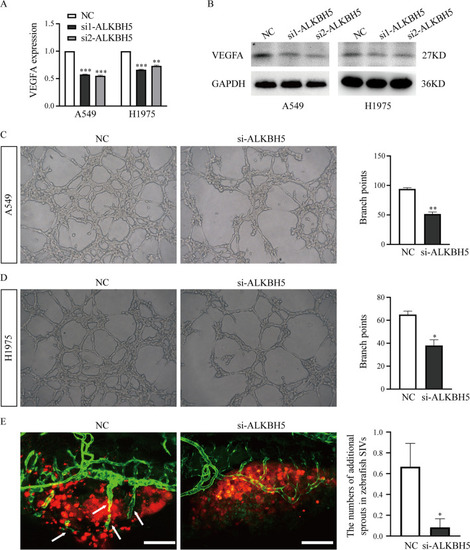
Knockdown of ALKBH5 inhibits the angiogenesis of lung cancer in vitro and in vivo. A, B The expression of VEGFA in A549 and H1975 cells when ALKBH5 was knocked down was detected with qRT‒PCR and western blotting. C, D HUVECs were cultured with conditioned medium from A549 or H1975 cells transfected with si-ALKBH5 or NC, and the tube formation was quantified. E The blood vessels sprouting from subintestinal vessels in zebrafish larvae were analyzed at 48 h after injection of A549 cells with si-ALKBH5 or NC transfection. The red signals indicate the cancer cells labeled CM-DiI. The green signals indicate the blood vessels that expressed EGFP. The white arrows indicate the new blood vessels that sprouted from subintestinal vessels in zebrafish larvae. NC: n = 12, si-ALKBH5: n = 12. Scale bar: 100 μm. *: P < 0.05, **: P < 0.01, ***: P < 0.001 |
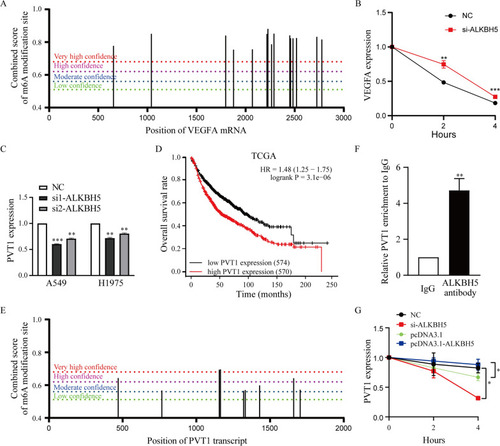
Knockdown of ALKBH5 decreases the stability of PVT1 but not VEGFA mRNA in lung cancer cells. A m6A modification sites of VEGFA mRNA were predicted by SRAMP. B The stability of VEGFA over time in A549 cells transfected with si-ALKBH5 was measured by qRT‒PCR relative to time point 0. C qRT‒PCR was used to detect the expression of PVT1 in A549 and H1975 cells after silencing ALKBH5. D Kaplan‒Meier analysis was used to analyze the correlation between PVT1 expression levels and overall survival of patients with lung cancer from the TCGA database. E m6A modification sites of PVT1 were predicted by SRAMP. F RIP experiments were performed in A549 cells and the coprecipitated RNA was subjected to qRT-PCR for PVT1. Expression levels of PVT1 are as fold enrichment in ALKBH5 antibody relative to IgG immunoprecipitates. G The stability of PVT1 over time in A549 cells transfected with si-ALKBH5 or pcDNA3.1-ALKBH5 was measured by qRT‒PCR relative to time point 0. *: P < 0.05, **: P < 0.01, ***: P < 0.001 |
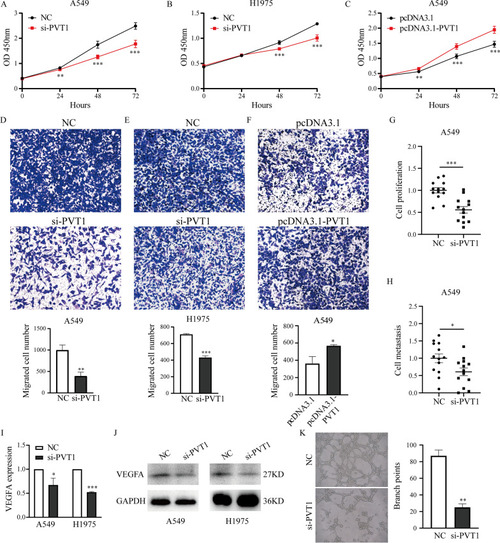
PVT1 promotes the proliferation, metastasis and angiogenesis of lung cancer cells. A–C CCK-8 assays were performed to evaluate the proliferation of lung cancer cells when PVT1 was knocked down or overexpressed. D-F Cell migration was evaluated by transwell assays when PVT1 was knocked down or overexpressed in lung cancer cells. G, H Statistical analysis of proliferation and metastasis in A549 cells after silencing PVT1 in zebrafish xenografts. NC: n = 13, si-PVT1: n = 13. I, J VEGFA expression in A549 and H1975 cells with PVT1 knockdown was measured by qRT‒PCR and western blotting. K HUVECs were cultured with conditioned medium from A549 cells transfected with si-PVT1 or NC, and the tube formation was quantified. *: P < 0.05, **: P < 0.01, ***: P < 0.001 |
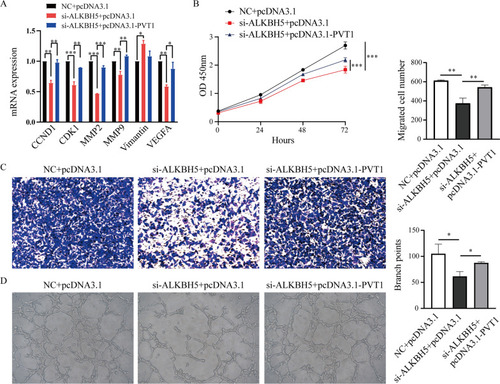
PVT1 overexpression partially restores the proliferation, migration and angiogenesis of lung cancer following suppression by ALKBH5 knockdown. A PVT1-regulated genes were examined by qRT-PCR in A549 cells cotransfected with si-ALKBH5 or NC and the pcDNA3.1 or pcDNA3.1-PVT1 plasmid. B CCK-8 assays were performed to assess proliferation in A549 cells cotransfected with si-ALKBH5 or NC and the pcDNA3.1 or pcDNA3.1-PVT1 plasmid. C Transwell assays were performed to assess the migration of A549 cells cotransfected with si-ALKBH5 or NC and the pcDNA3.1 or pcDNA3.1-PVT1 plasmid. D HUVECs were treated with conditioned medium from A549 cells cotransfected with si-ALKBH5 or NC and the pcDNA3.1 or pcDNA3.1-PVT1 plasmid, and the tube formation was quantified. *: P < 0.05, **: P < 0.01, ***: P < 0.001 |