
- Title
-
Kiaa1024L/Minar2 is essential for hearing by regulating cholesterol distribution in hair bundles
- Authors
- Gao, G., Guo, S., Zhang, Q., Zhang, H., Zhang, C., Peng, G.
- Source
- Full text @ Elife

(A) RNA in situ hybridization results showed that minar2 was specifically expressed by the hair cells of the inner ears and the lateral line neuromasts (5 dpf). Arrows point to hair cells. An asterisk in the upper panel marks a head neuromast located next to the inner ear. AC: anterior crista; LC: lateral crista; PC: posterior crista; UM: utricular macula; SM: saccular macula. (B) C-start response rates for wild type and homozygous minar2fs139 mutants at 8 dpf (n=63 and 64, respectively. ****p<0.0001, Mann-Whitney test). (C) Auditory evoked potentials (AEP) thresholds in wild type and the minar2fs139 mutants (n=11 and 13, respectively. For 100-, 200-, and 400 Hz, **p<0.01). (D) Evaluation of mechanotransduction by AM 1–43 staining. The lateral line L3 neuromasts of 5 dpf and 8 dpf larvae were imaged and quantified (for 5 dpf, n=35 and 36, t=7.465, df = 64.84, ****p<0.0001; for 8 dpf, n=49 and 51, t=6.444, df = 86.90, ****p<0.0001). (E) Quantification of hair cell numbers by counting the myo6:Gal4FF;UAS-EGFP-positive cells in lateral line L3 neuromast (for 5 dpf, n=30 and 32, t=2.578, df = 59.93, *p=0.0124; for 8 dpf, n=58 and 58, t=4.148, df = 114, ****p<0.0001). (F) Quantification of hair cell numbers in the inner ears of zebrafish adult. Hair bundles in dissected utricles (upper panels) and saccules (lower panels) were labeled with fluorescence-conjugated phalloidin. Diagrams of a utricle and saccule on the left. Numbered boxes (1-3) in the diagrams indicate the positions of imaged and counted areas (for utricles, n=15 and 19; for saccules, n=12 and 9. *p<0.05, **p<0.01, ***p<0.001). A: anterior; L: lateral; P: posterior; V: ventral. Scale bars represent 25 μm (A), and 10 μm (D, E, and F).
|
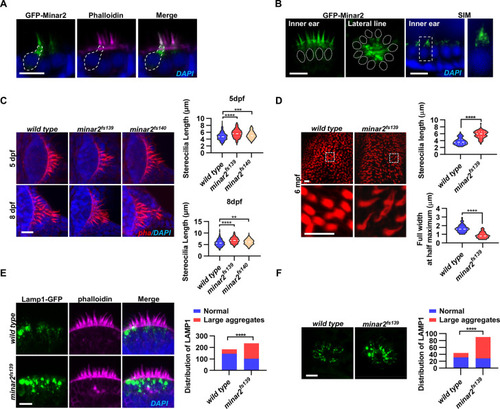
(A) Representative images of transiently expressed GFP-Minar2 in hair cells. The dashed line marks the border of a hair cell expressing GFP-Minar2. Stereocilia were labeled with phalloidin. Nuclei were counterstained by DAPI. (B) Distribution of GFP-Minar2 in hair cells in the stable myo6:GFP-Minar2 transgenic line. Representative images of hair cells of lateral crista of the inner ear (Inner ear) and lateral line neuromast (Lateral line). Dashed lines mark the nuclei of hair cells. Hair cells were also imaged with structured illumination microscopy (SIM), a super-resolution method. The right panel shows an enlarged view of the boxed area. (C) Quantification of hair bundle lengths of the inner ear hair cells in zebrafish larvae. Hair bundles were labeled with phalloidin and the lateral crista regions of inner ears were imaged. Hair bundle lengths were measured from 34, 29, and 22 images of wild type, minar2fs139, and minar2fs140 larvae at 5 dpf, or 36, 23, and 23 images of respective larvae at 8 dpf. For 5 dpf, n=340, 290, and 220, F(2, 847)=42.58, p<0.001; For 8 dpf, n=360, 230, and 230, F(2, 817)=42.95, p<0.001. Multiple comparison significance values are indicated on the graph. (D) Quantification of hair bundle lengths and width of inner ear hair cells in zebrafish adult (6 mpf). The bottom panels show enlarged views of the boxed area. Hair bundles in the saccules were measured from 8 images for the wild type, and 8 images for the minar2fs139 mutant. n=80 and 80. ****p<0.0001. (E–F) Morphology and distribution of Lamp1-labeled lysosomes in the hair cells of the inner ear (E) and lateral line neuromast (F) in zebrafish larvae (5 dpf). For the inner ear, 36 and 44 images of lateral crista regions in the wild type and minar2fs139 mutant were counted, respectively (n=184 and 236, ****p<0.0001, Fisher’s exact test). For the lateral line, 10 and 15 images of lateral line L3 neuromasts were counted (n=44 and 90, ****p<0.0001, Fisher’s exact test). Scale bars represent 10 μm.
|
Minar2 increases cholesterol labeling and colocalizes with cholesterol in cultured cells. ( |
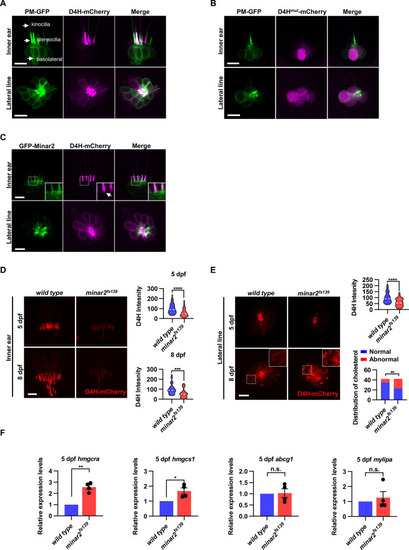
(A) Representative images of PM-GFP and D4H-mCherry expressed in hair cells. The plasma membrane probe PM-GFP labels kinocilia, stereocilia, and basolateral membranes (arrows). The cholesterol probe D4H-mCherry mostly labels the stereocilia in the inner ear. The lateral crista of the inner ear and the L3 lateral line neuromast were imaged. (B) Representative images of PM-GFP and non-binding D4Hmut-mCherry expressed in hair cells. The non-binding D4Hmut-mCherry carried a D4HT490G-L491G mutation that abolishes cholesterol binding. (C) Distribution of GFP-Minar2 and D4H-mCherry in hair cells in stable transgenic zebrafish. GFP-Minar2 and D4H-mCherry extensively co-localize in the stereocilia and a few structures just below the stereocilia (arrow in figure insert). (D) Quantification of the intensity of cholesterol probe D4H-mCherry in the inner ear hair cells. The lateral crista regions of the inner ears were imaged and quantified. For the 5 dpf groups, n=49 and 49 for the wild type and the minar2fs139 mutant, respectively. t=4.446, df = 93.30, ****p<0.0001; For the 8 dpf groups, n=39 and 36, t=3.982, df = 72.30, ***p<0.001. (E) Quantification of the intensity and appearance of D4H-mCherry in the lateral line hair cells. The lateral line L3 neuromasts were imaged and quantified. For the 5 dpf groups, the intensity of D4H-mCherry was quantified. n=40 and 33, t=4.438, df = 70.81, ****p<0.0001. For the 8 dpf groups, the appearance of abnormally enlarged vesicles was quantified. Figure inserts show large vesicles in the basolateral regions in the minar2fs139 mutant. n=42 and 42, **p<0.01, Fisher’s exact test. (F) Quantification of expression levels of genes involved in cholesterol metabolism. The Srebp2 target gene (hmgcra and hmgcs1) and LXR target gene (abcg1 and mylipa) were examined by qRT-PCR. Expression levels relative to GAPDH levels were normalized to the wild-type control group. For hmgcra, t=7.805, df = 3, **p<0.01. For hmgcs1, t=3.217, df = 3, *p<0.05. Scale bars represent 10 μm.
|

(A) Quantification of D4H-mCherry intensity in wild type and mutant minar2fs139 larvae after 2HPβCD treatment. The lateral line L3 neuromast was imaged and quantified. n=45, 41, 52, and 51. F(3, 110.2)=74.76, p<0.0001. (B) Quantification of AM1-43 labeling in wild type and mutant minar2fs139 larvae after 2HPβCD treatment. n=49, 46, 49, and 51. F(3, 155.4)=124.4, p<0.0001. (C) Quantification of D4H-mCherry intensity in wild type and mutant minar2fs139 larvae after U18666A treatment. n=40, 31, 42, and 33. F(3, 111.3)=39.34, p<0.0001. (D) Quantification of AM1-43 labeling in wild type and mutant minar2fs139 larvae after U18666A treatment. n=53, 50, 52, and 46. F(3, 169.9)=158.0, p<0.0001. EM: embryonic medium, solvent control groups for 2HPβCD treatment (A and B); DMSO: solvent control groups for U18666A treatment (C and D); Multiple comparison significance values are indicated on the graph. Scale bars represent 10 μm.
|
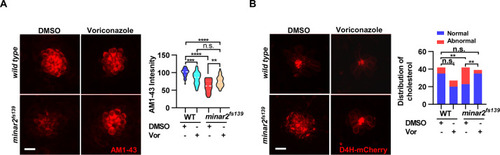
(A) Quantification of D4H-mCherry in hair cells of wild type and minar2fs139 zebrafish after efavirenz treatment. The lateral line L3 neuromast was imaged and quantified. n=40, 41, 42, and 41. F(3, 127.8)=7.557, p<0.001. (B) Quantification of AM1-43 labeling in wild type and mutant minar2fs139 larvae after efavirenz treatment. n=31, 33, 33, and 30. F(3, 115.7)=46.65, p<0.0001. (C) Effects of efavirenz treatment on the appearance of abnormally enlarged vesicles in hair cells of wild type and mutant minar2fs139 zebrafish. n=42, 38, 42, and 34. χ2=20.92, df = 3, p<0.001. (D) Effects of efavirenz treatment on C-start response rates for wild type and minar2fs139 mutants (n=48 for all 4 groups. p<0.0001, Kruskal-Wallis test). DMSO: solvent control groups; Efa: efavirenz treatment groups. Multiple comparison significance values are indicated on the graph. Scale bars represent 10 μm.
|
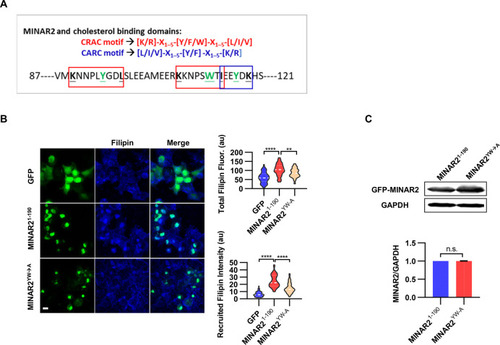
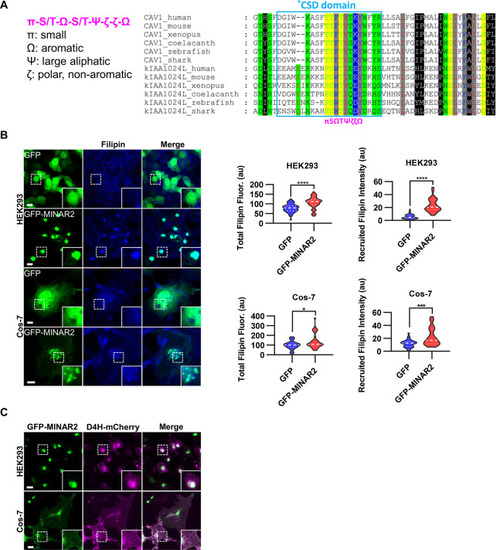
(A) Cholesterol recognition motifs in Minar2 primary sequence. The sequences for cholesterol-recognizing amino-acid consensus (CRAC, red letter and box) and its analog CARC (blue letter and box) are indicated. The critical aromatic resides (Y/W, in green letters) were mutated to alanine in the point mutation MINAR2YW-A construct. (B) Effects of critical aromatic reside mutation on the levels and distributions of filipin labeling in cultured cells. HEK293 cells were transfected with GFP alone (GFP), full length (GFP-MINAR21-190), or the point mutation construct (GFP-MINAR2YW-A). n=44, 46, and 62, for total filipin fluorescence, F(2, 149)=23.80, p<0.0001; for recruited filipin intensity, F(2, 105.5)=79.28, p<0.0001. Multiple comparison significance values are indicated on the graph. Scale bars represent 10 μm. (C) Immunoblot analysis of the expression levels of the full-length construct (GFP-MINAR21-190) and the point mutation construct (GFP-MINAR2YW-A) in HEK293 cells. Expression levels relative to GAPDH were quantified. t=0.7498, df = 2, p=0.532.
|