
Figure 2
- ID
- ZDB-IMAGE-221211-159
- Publication
- Gao et al., 2022 - Kiaa1024L/Minar2 is essential for hearing by regulating cholesterol distribution in hair bundles
- All Figures
- Figures for Gao et al., 2022
|
Figure 2
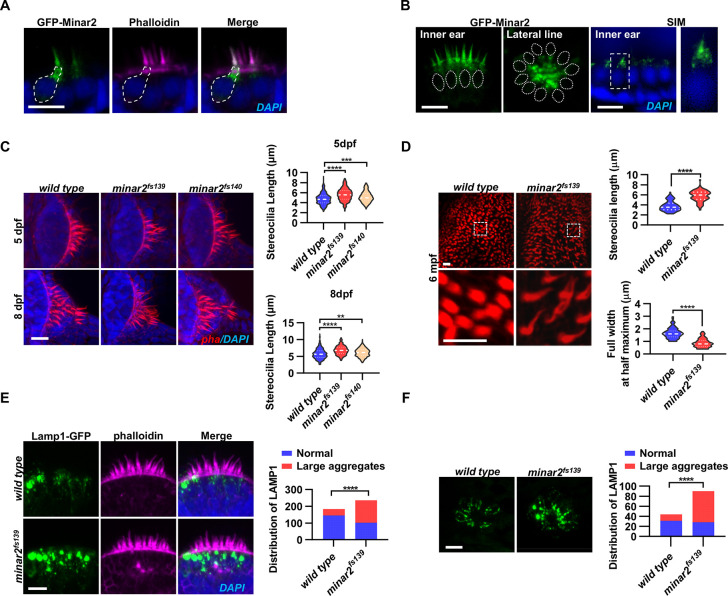
(A) Representative images of transiently expressed GFP-Minar2 in hair cells. The dashed line marks the border of a hair cell expressing GFP-Minar2. Stereocilia were labeled with phalloidin. Nuclei were counterstained by DAPI. (B) Distribution of GFP-Minar2 in hair cells in the stable myo6:GFP-Minar2 transgenic line. Representative images of hair cells of lateral crista of the inner ear (Inner ear) and lateral line neuromast (Lateral line). Dashed lines mark the nuclei of hair cells. Hair cells were also imaged with structured illumination microscopy (SIM), a super-resolution method. The right panel shows an enlarged view of the boxed area. (C) Quantification of hair bundle lengths of the inner ear hair cells in zebrafish larvae. Hair bundles were labeled with phalloidin and the lateral crista regions of inner ears were imaged. Hair bundle lengths were measured from 34, 29, and 22 images of wild type, minar2fs139, and minar2fs140 larvae at 5 dpf, or 36, 23, and 23 images of respective larvae at 8 dpf. For 5 dpf, n=340, 290, and 220, F(2, 847)=42.58, p<0.001; For 8 dpf, n=360, 230, and 230, F(2, 817)=42.95, p<0.001. Multiple comparison significance values are indicated on the graph. (D) Quantification of hair bundle lengths and width of inner ear hair cells in zebrafish adult (6 mpf). The bottom panels show enlarged views of the boxed area. Hair bundles in the saccules were measured from 8 images for the wild type, and 8 images for the minar2fs139 mutant. n=80 and 80. ****p<0.0001. (E–F) Morphology and distribution of Lamp1-labeled lysosomes in the hair cells of the inner ear (E) and lateral line neuromast (F) in zebrafish larvae (5 dpf). For the inner ear, 36 and 44 images of lateral crista regions in the wild type and minar2fs139 mutant were counted, respectively (n=184 and 236, ****p<0.0001, Fisher’s exact test). For the lateral line, 10 and 15 images of lateral line L3 neuromasts were counted (n=44 and 90, ****p<0.0001, Fisher’s exact test). Scale bars represent 10 μm.
Localization and function of Minar2 in the stereocilia and the apical region of the hair cells.