- Title
-
Cloning, Exogenous Expression and Function Analysis of Interferon-γ from Gadus macrocephalus
- Authors
- Jiang, J., Gu, J., Zhan, A., Mao, M., Liu, Y., Wang, H., Mao, Y.
- Source
- Full text @ Viruses
|
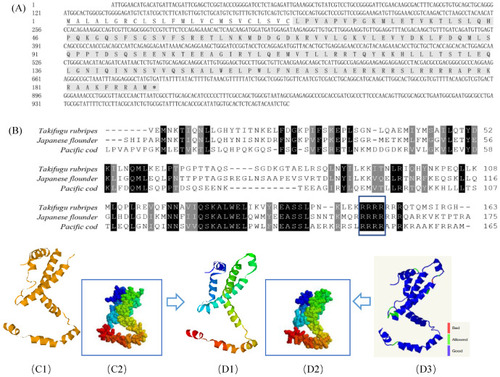
Bioinformatic analysis of GmIFN–γ gene. (A) cDNA and the deduced amino acid of GmIFN–γ. Signal peptide was underlined. (B) Mature IFN–γ peptides among Takifugu rubripes, Japanese flounder and G. macrocephalus were aligned. Identical or similar amino acids are shaded (black: present in all species; dark gray: present in 80% of the species). The nuclear localization signal and the putative IFN–γ signature sequence are boxed in green. (C1–D3): 3D models of IFN–γ compared between Japanese flounder and G. macrocephalus. (C1,C2): a 3D model of Japanese flounder displayed in Ribbons and Spacefill style, separately. PDB code is c6f1eA. (D1,D2): a 3D model of GmIFN–γ was constructed based on the template c6f1eA. Both were displayed in Ribbons and Spacefill style, separately. (D3) Secondary structure assignment was carried using PROCHECK. Good quality is indicated in blue, while the bad quality is indicated in red. |
|
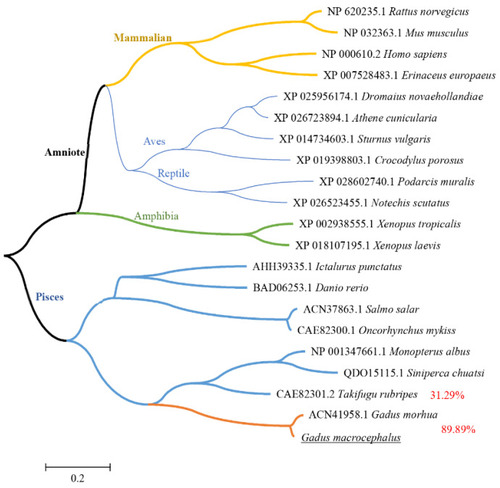
Phylogenetic tree of vertebrate IFN–γ peptides. The trees were computed using Neighbor-Joining method by MEGA version 5.0. Different levels of evolution were highlighted in various color. |
|
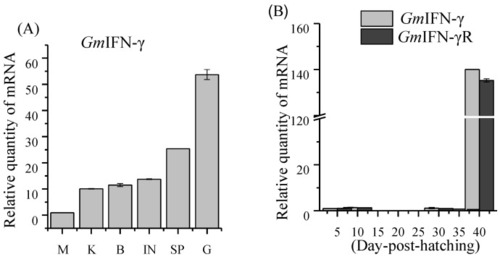
Expression profiles of GmIFN–γ. (A) Expression levels of GmIFN–γ in adult Pacific cod muscle (M), kidney (K), brain (B), intestine (I), spleen (SP) and gill (G). (B) Expression pattern of GmIFN–γ and its receptor in cod larvae during the early developmental stages. |
|
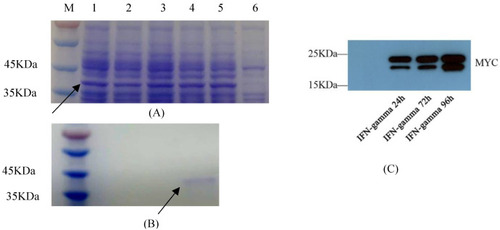
Exogenous expression of GmIFN–γ. (A) Optimization of prokaryotic expression conditions. Nos. 1–5 indicate that the protein was induced for 1–5 h. No. 6 was set as the control. Target protein was marked by arrow. (B) Purification of GmIFN–γ from E. coli. Target protein was marked by arrow. (C) GmIFN–γ expressed in yeast GS115 and detected using Western blot at 24, 72 and 96 h, respectively. |
|
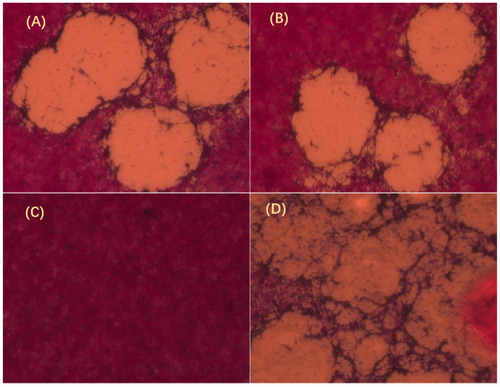
GmIFN–γ inhibits Spring viremia of carp virus (SVCV) growth observed by plaque assay. (A) GmIFN–γ from yeast expression. (B) GmIFN–γ from prokaryotic expression. (C) EPC was used as a negative control. (D) EPC was infected by SVCV as a positive control. Live cells were stained red with neutral red indicator. The concentrations of purified GmIFN–γ from yeast expression and prokaryotic expression were both 100 μg/mL. |
|
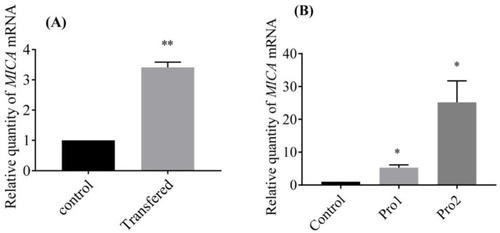
MICA was induced by GmIFN–γ. (A) pcDNA3.1-GmIFN–γ was transferred into EPC cells, and the endogenous GmIFN–γ induced the MICA expression; ** indicates p < 0.01. (B) EPC cells were incubated with 100 μg/mL GmIFN–γ for 24 h. Pro1 was from E. coli BL21, while Pro2 was from P. pastoris GS115; * indicates p < 0.05. |
|
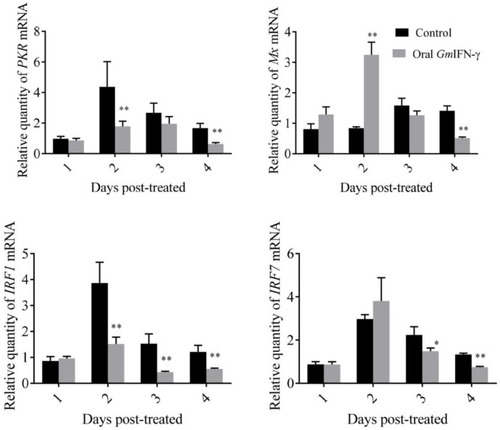
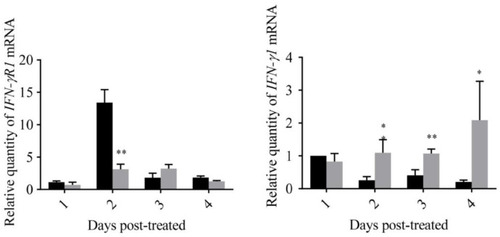
Expression levels of genes related to the IFN–I signal pathway of zebrafish fed with yeast containing GmIFN–γ. T tests were used for statistical analysis. * indicates significant differences ( |
|
Expression levels of genes related to the IFN–I signal pathway of zebrafish fed with yeast containing GmIFN–γ. T tests were used for statistical analysis. * indicates significant differences ( |

