
- Title
-
Conserved and diverged asymmetric gene expression in the brain of teleosts
- Authors
- Agostini, C., Bühler, A., Antico Calderone, A., Aadepu, N., Herder, C., Loosli, F., Carl, M.
- Source
- Full text @ Front Cell Dev Biol
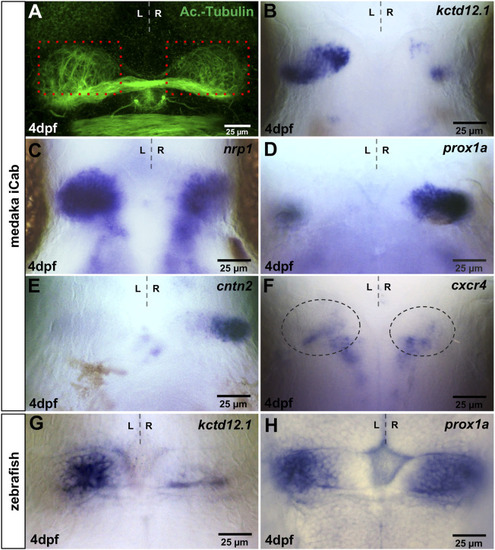
Visualisation of asymmetries in the medaka habenulae. iCab embryos at four dpf focused on the dorsal diencephalon; anterior to the top. (A) Immunostaining for anti-acetylated tubulin shows subtle left-right asymmetric dendritic arborisation in the habenula. Please compare the green signal within the same-sized red boxes. (B–H) Expression of habenula and pineal complex marker genes. (B,C) kctd12.1 and nrp1 are stronger expressed in left-sided habenular neurons. (D,E) prox1a and cntn2 are mainly expressed in right-sided habenular neurons, while (F) cxcr4b is expressed in habenular progenitors, the area of which is encircled. (G) In the zebrafish, kctd12.1 is expressed in lateral neurons of the dorsal habenulae, while (H) prox1a is expressed in medial dorsal habenular neurons. |
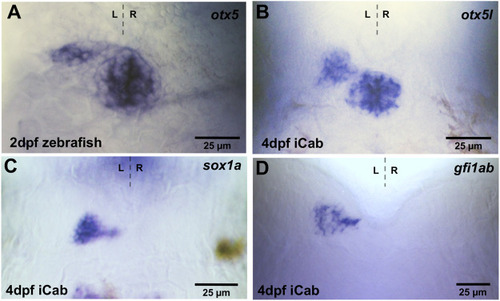
Expression of pineal and parapineal marker genes in the pineal complex. Zebrafish and iCab embryos at stages indicated focused on the dorsal diencephalon; anterior to the top. (A,B) otx5/otx5l is expressed in the pineal and parapineal in zebrafish and medaka, while (C,D) sox1a and gfi1ab are specifically expressed in the parapineal. |
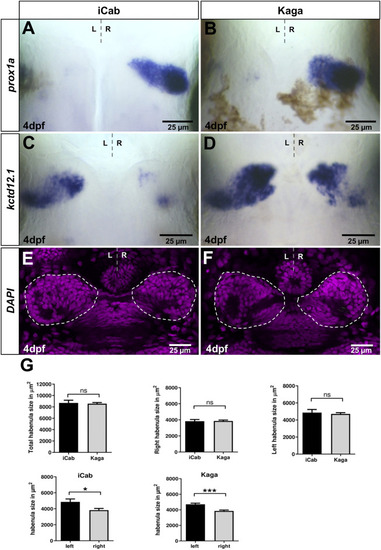
Habenular marker genes have conserved and diverged expression patterns in distant medaka strains. Dorsal views focused on the diencephalon at four dpf, anterior to the top. (A,B) prox1a expression in right-sided habenular neurons is comparable in iCab and Kaga, whereas (C,D) kctd12.1 expression is particularly enlarged in right-sided habenular neurons in Kaga. (E,F) Single plane confocal images of the diencephalon of DAPI labeled embryos (niCab = 6; nKaga = 9). (G) No difference in habenular size between iCab and Kaga embryos, but a significant difference between the left and right habenulae in both populations was found. Dashed lines indicate the habenulae in (E,F). Bar graphs show the means of the habenular areas. Error bars represent SEM (standard error of the mean). |
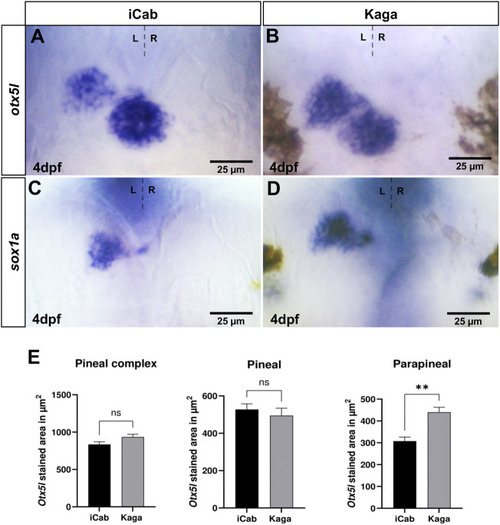
Parapineal size differs significantly between Kaga and iCab embryos. Dorsal views focused on the diencephalon of four dpf embryos with anterior to the top. (A–D) otx5l and sox1a are expressed in pineal/parapineal of both iCab and Kaga embryos. (A,B,E) The parapineal expression domain of otx5l is significantly larger in Kaga embryos compared to iCab embryos, whereas no size difference of the otx5l expression domain in the pineal alone or in the pineal/parapineal complex together was detected (niCab = 5; nKaga = 5). Bar graphs show the means of the pineal complex, pineal and parapineal areas. Error bars represent SEM (standard error of the mean). |