
- Title
-
Identification, conservation, and expression of tiered pharmacogenes in zebrafish
- Authors
- Demery-Poulos, C., Chambers, J.M.
- Source
- Full text @ PLoS One
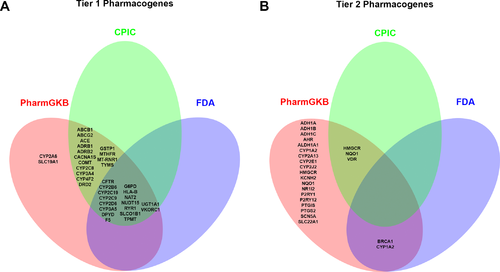
Fig 1. Comparison of tiered pharmacogene sources. Venn diagrams of Tier 1 (A) and Tier 2 (B) pharmacogenes included from the three sources: PharmGKB (red), CPIC (green), and the FDA (blue). |
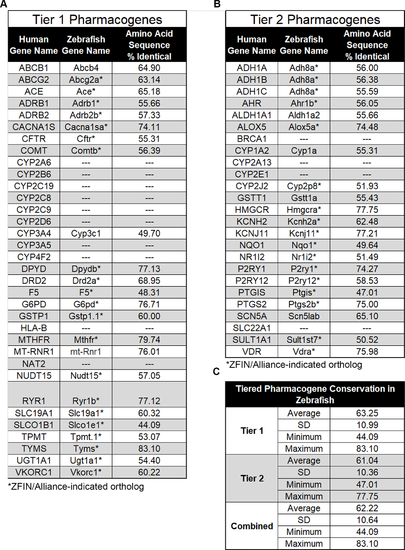
Fig 2. Pharmacogene orthologs and amino acid conservation. Tables with Tier 1 (A) and Tier 2 (B) human pharmacogenes (left), the orthologous zebrafish gene (middle), and the conservation in amino acid sequence as determined by NCBI BLAST. C. Summary tables of averages, standard deviation (SD), minimum, and maximums for Tier 1, Tier 2, and combined. *indicates ZFIN/Alliance-indicated ortholog. |
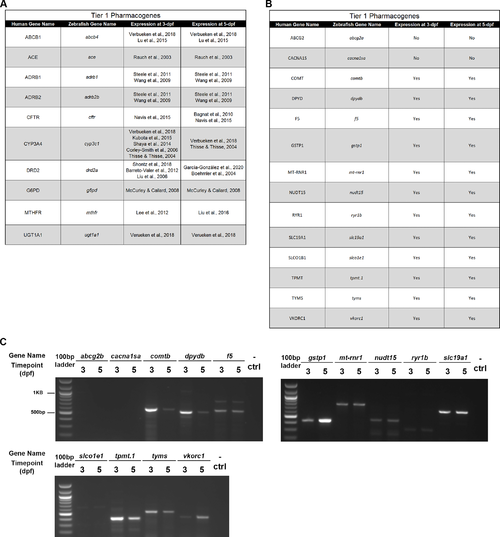
Fig 3. Zebrafish expression of Tier 1 pharmacogenes. A. Previously published literature housing information on expression of Tier 1 pharmacogenes in zebrafish. B. Tier 1 pharmacogene expression in zebrafish: “Yes” indicates expression was noted, “No” indicates no expression found. C. RT-PCR gel results for each Tier 1 zebrafish ortholog not previously identified in the literature. Gene name is listed at the top with the 3-days post fertilization (dpf) and 5-dpf included under the respective gene in alphabetical order. Each gel had a 100-base pair (bp) ladder (left) and a negative control (- ctrl, left). |
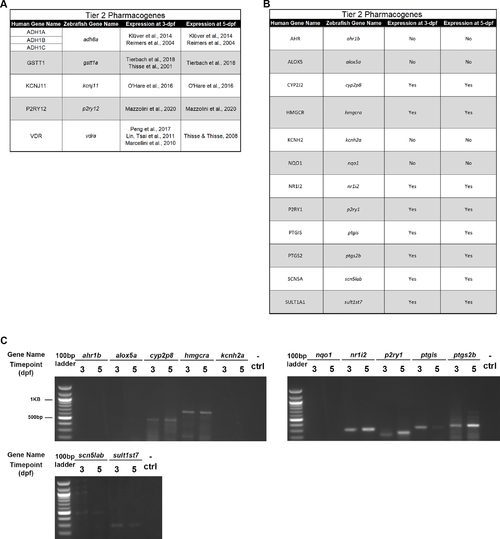
Fig 4. Zebrafish expression of Tier 2 pharmacogenes. A. Previously published literature housing information on expression of Tier 2 pharmacogenes in zebrafish. B. Tier 2 pharmacogene expression in zebrafish: “Yes” indicates expression was noted, “No” indicates no expression found. C. RT-PCR gel results for each Tier 2 zebrafish ortholog not previously identified in the literature. Gene name is listed at the top with the 3-days post fertilization (dpf) and 5-dpf included under the respective gene in alphabetical order. Each gel had a 100-base pair (bp) ladder (left) and a negative control (- ctrl, left). |
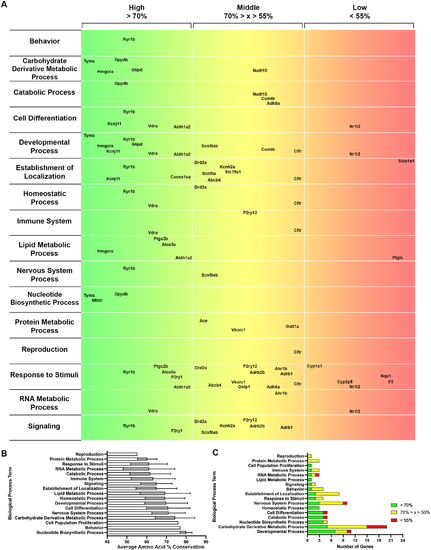
Fig 5. Gene ontology analysis for biological processes of tiered pharmacogenes. A. A map with the Biological Process terms listed (left), amino acid sequence conservation in 3 groups: > 70% = High (green to yellow, left to right), 70% > x > 55% = Middle (yellow to orange, left to right), and < 55% = Low (orange to red, left to right). The genes are placed within the respective horizontal location based on their % conservation. B. Average amino acid conservation for each Biological Process term +/- SD. C. The number of pharmacogenes in each category (High = green, Middle = yellow, Low = red) for each Biological Process term. |
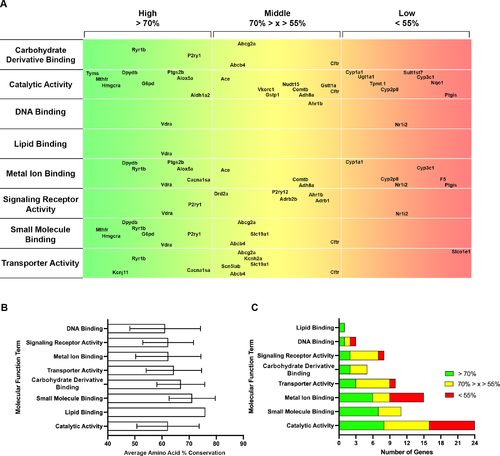
Fig 6. Gene ontology analysis for molecular functions of tiered pharmacogenes. A. A map with the Molecular Function terms listed (left), amino acid sequence conservation in 3 groups: > 70% = High (green to yellow, left to right), 70% > x > 55% = Middle (yellow to orange, left to right), and < 55% = Low (orange to red, left to right). The genes are placed within the respective horizontal location based on their % conservation. B. Average amino acid conservation for each Molecular Function term +/- SD. C. The number of pharmacogenes in each category (High = green, Middle = yellow, Low = red) for each Molecular Function term. |
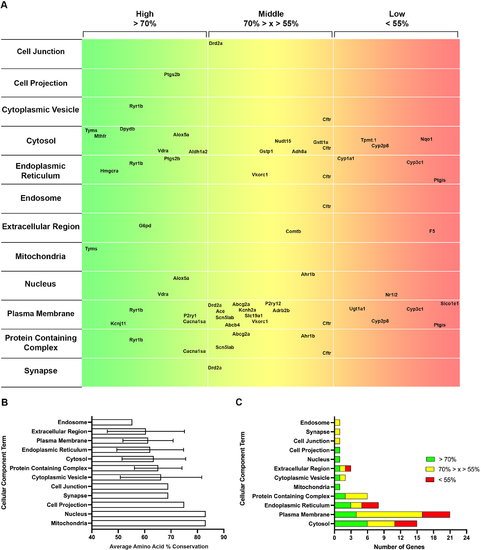
Fig 7. Gene ontology analysis for cellular components of tiered pharmacogenes. A. A map with the Cellular Component terms listed (left), amino acid sequence conservation in 3 groups: > 70% = High (green to yellow, left to right), 70% > x > 55% = Middle (yellow to orange, left to right), and < 55% = Low (orange to red, left to right). The genes are placed within the respective horizontal location based on their % conservation. B. Average amino acid conservation for each Cellular Component term +/- SD. C. The number of pharmacogenes in each category (High = green, Middle = yellow, Low = red) for each Cellular Component term. |
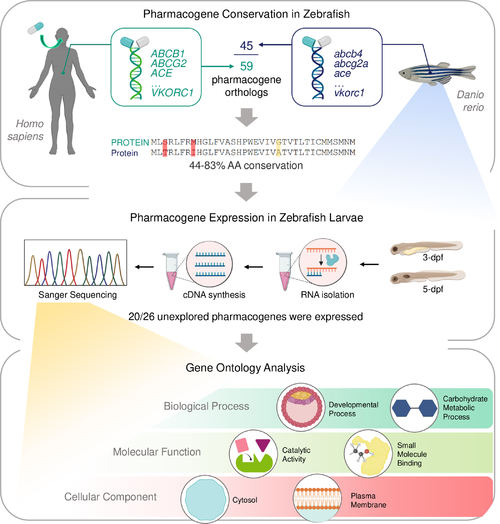
Fig 8. Summary of study design and novel findings. Out of 59 Tier 1 and 2 human pharmacogenes, 45 were determined to have a zebrafish ortholog. The range of amino acid conservation between species was 44 – 83%. For pharmacogenes without published expression data, 3- and 5-dpf zebrafish were collected for gene expression analysis. Expression was demonstrated for 20 out of 26 previously unexplored pharmacogene orthologs. Gene ontology analysis of all 45 pharmacogene orthologs identified the top Biological Process, Molecular Function, and Cellular Component terms for future research, based on the number of highly conserved genes associated with each term. |