
Fig. 5
- ID
- ZDB-FIG-220831-43
- Publication
- Demery-Poulos et al., 2022 - Identification, conservation, and expression of tiered pharmacogenes in zebrafish
- Other Figures
- All Figure Page
- Back to All Figure Page
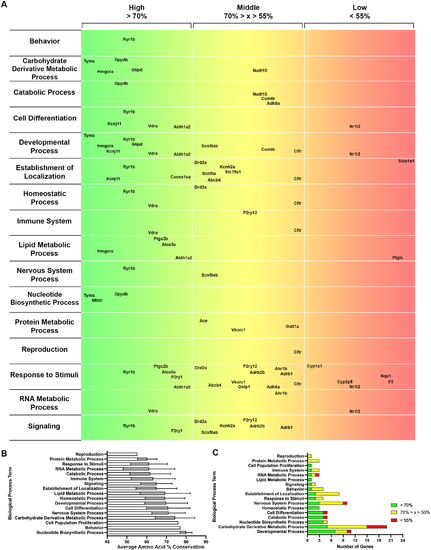
Fig 5. Gene ontology analysis for biological processes of tiered pharmacogenes. A. A map with the Biological Process terms listed (left), amino acid sequence conservation in 3 groups: > 70% = High (green to yellow, left to right), 70% > x > 55% = Middle (yellow to orange, left to right), and < 55% = Low (orange to red, left to right). The genes are placed within the respective horizontal location based on their % conservation. B. Average amino acid conservation for each Biological Process term +/- SD. C. The number of pharmacogenes in each category (High = green, Middle = yellow, Low = red) for each Biological Process term. |