
- Title
-
Transcriptomic and Phenotypic Analysis of CRISPR/Cas9-Mediated gluk2 Knockout in Zebrafish
- Authors
- Yan, Q., Li, W., Gong, X., Hu, R., Chen, L.
- Source
- Full text @ Genes (Basel)
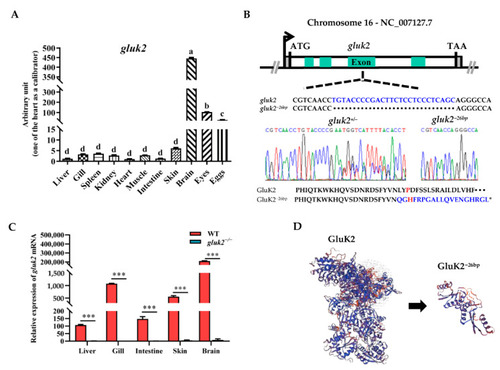
Distribution and knockout of the gluk2 gene in zebrafish. (A). The relative mRNA levels of gluk2 are determined in selected tissues of wild-type. Analysis of variance (ANOVA) and the Duncan test are applied on the data, p < 2 × 10⁻¹⁶. a−d: The same letter indicates no difference between means as determined (p < 0.05), different letters indicate a significant difference (p < 0.05). (B). gluk2 locus, with gluk2−26bp mutation and a premature stop in gluk2−26bp. Asterisk indicates stop codon. (C). The relative mRNA levels of gluk2 are determined in wild-type and gluk2−/− mutant. Values plotted are means ± SEM, *** p < 0.001, compared with control. (D). The predicted three-dimensional structures of GluK2 and GluK2−26bp. |
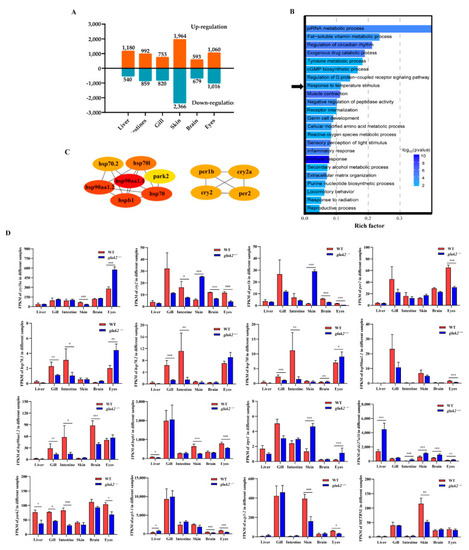
Divergent pathway and gene expression between wild-type and gluk2−/− mutant. (A) Number of DEGs obtained from the six tissues at the wild-type and gluk2−/− mutant. (B) Gene Ontology (GO) enrichment analysis of differentially expressed genes identified from the wild-type and gluk2−/− mutant. The abscissa represents the GO terms, and the ordinate represents the number of target genes. Black arrow indicates the ‘Response to temperature stimulus’ pathway. (C) Protein–protein interaction network for gluk2−/− expressed in the response to temperature stimulus pathway. (D) Fragments Per Kilobase per Million (FPKM) of divergent gene expression related to temperature signaling pathway in different tissues. Values plotted are means ± SEM, * p < 0.05, ** p < 0.01, *** p < 0.001, compared with control. |
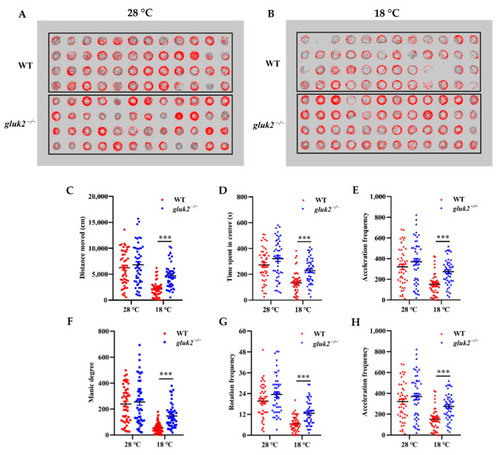
Effects of low temperature on the 7 dpf wild-type and gluk2−/− zebrafish locomotor activities. (A) Wild-type and gluk2−/− zebrafish in a 96-well plate during tracking at 28 °C. (B) Wild-type and gluk2−/− zebrafish in a 96-well plate during tracking at 18 °C. (C) Distance moved by the wild-type and gluk2−/− zebrafish larvae at 28 °C and 18 °C. (D) Time spent in center by the wild-type and gluk2−/− zebrafish larvae at 28 °C and 18 °C. (E) Acceleration frequency by the wild-type and gluk2−/− zebrafish larvae at 28 °C and 18 °C. (F) Manic degree by the wild-type and gluk2−/− zebrafish larvae at 28 °C and 18 °C. (G) Rotation frequency by the wild-type and gluk2−/− zebrafish larvae at 28 °C and 18 °C. (H) Active frequency by the wild-type and gluk2−/− zebrafish larvae at 28 °C and 18 °C. Values plotted are means ± SEM, *** p < 0.001, compared with control. PHENOTYPE:
|
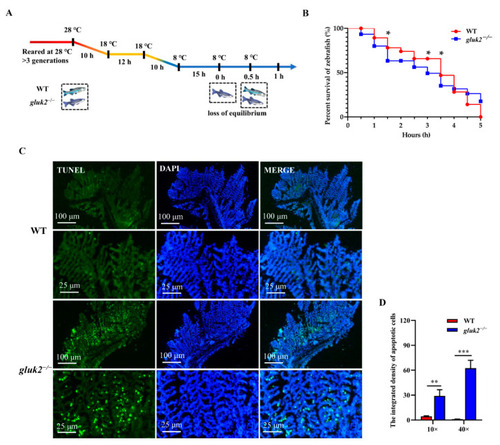
Distinct cold tolerance in wild-type and gluk2−/− zebrafish under the cooling scheme. (A) The changes in the body equilibrium of wild-type and gluk2−/− zebrafish over time at 8 °C. (B) The percent survival of wild-type and gluk2−/− zebrafish at 8 °C from 0 h to 5 h. (C) TUNEL assays in the gills of wild-type and genotypes, indicating a more serious apoptosis in gluk2−/− mutant than in wild-type at the same cold temperature. Scale bar are 100 μm and 25 μm. (D) Comparison of apoptotic cell populations in the gills of wild-type and gluk2−/− zebrafish over time at 8 °C. Values plotted are means ± SEM, * p < 0.05, ** p < 0.01, *** p < 0.001, compared with control, and are based on at least three biological replicates, with each replicate having at least 3 individuals at each time point. PHENOTYPE:
|