
Fig. 2
- ID
- ZDB-IMAGE-220829-138
- Publication
- Yan et al., 2022 - Transcriptomic and Phenotypic Analysis of CRISPR/Cas9-Mediated gluk2 Knockout in Zebrafish
- All Figures
- Figures for Yan et al., 2022
|
Fig. 2
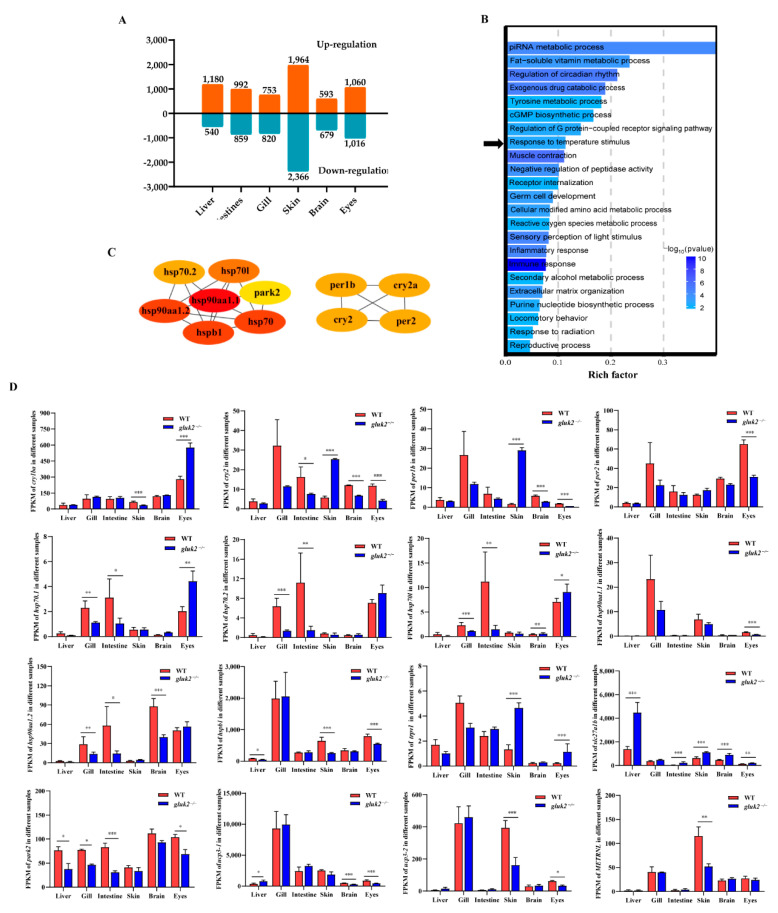
Divergent pathway and gene expression between wild-type and gluk2−/− mutant. (A) Number of DEGs obtained from the six tissues at the wild-type and gluk2−/− mutant. (B) Gene Ontology (GO) enrichment analysis of differentially expressed genes identified from the wild-type and gluk2−/− mutant. The abscissa represents the GO terms, and the ordinate represents the number of target genes. Black arrow indicates the ‘Response to temperature stimulus’ pathway. (C) Protein–protein interaction network for gluk2−/− expressed in the response to temperature stimulus pathway. (D) Fragments Per Kilobase per Million (FPKM) of divergent gene expression related to temperature signaling pathway in different tissues. Values plotted are means ± SEM, * p < 0.05, ** p < 0.01, *** p < 0.001, compared with control.