
Fig. 1
- ID
- ZDB-IMAGE-220829-137
- Genes
- Publication
- Yan et al., 2022 - Transcriptomic and Phenotypic Analysis of CRISPR/Cas9-Mediated gluk2 Knockout in Zebrafish
- All Figures
- Figures for Yan et al., 2022
|
Fig. 1
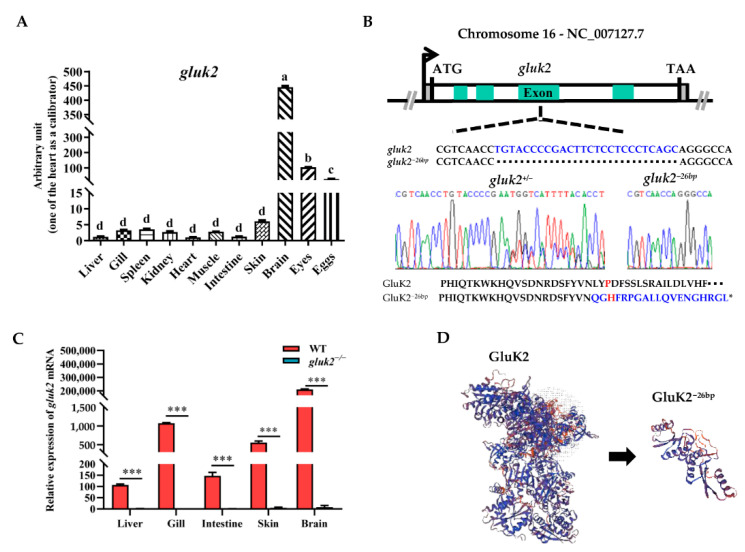
Distribution and knockout of the gluk2 gene in zebrafish. (A). The relative mRNA levels of gluk2 are determined in selected tissues of wild-type. Analysis of variance (ANOVA) and the Duncan test are applied on the data, p < 2 × 10⁻¹⁶. a−d: The same letter indicates no difference between means as determined (p < 0.05), different letters indicate a significant difference (p < 0.05). (B). gluk2 locus, with gluk2−26bp mutation and a premature stop in gluk2−26bp. Asterisk indicates stop codon. (C). The relative mRNA levels of gluk2 are determined in wild-type and gluk2−/− mutant. Values plotted are means ± SEM, *** p < 0.001, compared with control. (D). The predicted three-dimensional structures of GluK2 and GluK2−26bp.