
- Title
-
Tetramethylpyrazine Protects Endothelial Injury and Antithrombosis via Antioxidant and Antiapoptosis in HUVECs and Zebrafish
- Authors
- Zhang, Y., Ma, C., He, L., Liao, L., Guo, C., Wang, C., Gong, L., Zhou, H., Fu, K., Peng, C., Li, Y.
- Source
- Full text @ Oxid Med Cell Longev
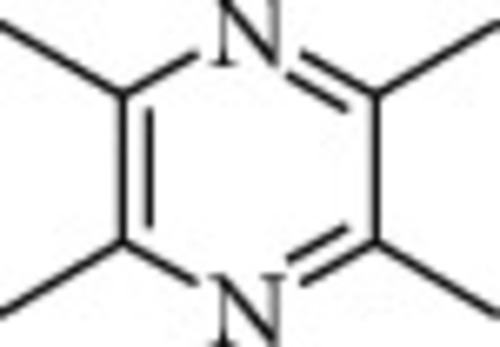
The chemical structure of tetramethylpyrazine (TMP). |
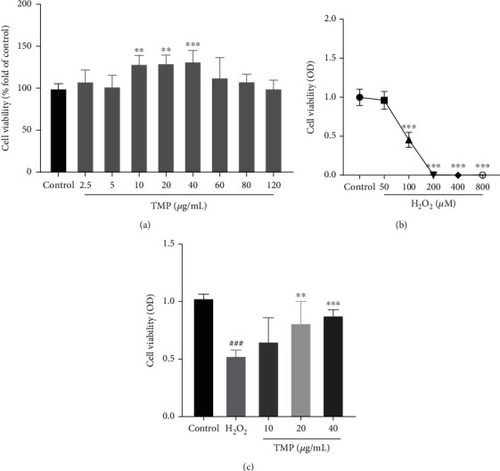
Detection of cell viability by MTT assay. (a) The effect of TMP on the viability of HUVECs. (b) The effect of H2O2 on the viability of HUVECs. (c) The viability of H2O2-induced injury following treatment with TMP at different concentrations. Values are presented as means ± S.D. ( |
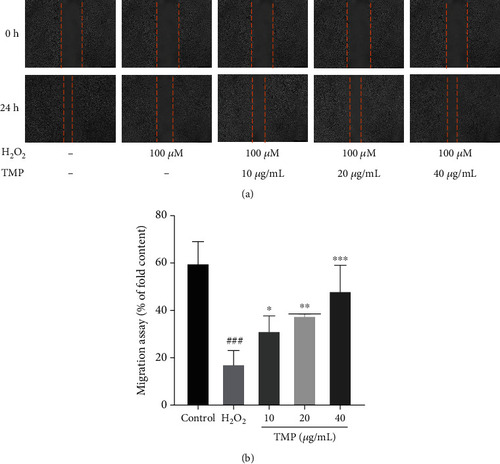
Detection of cell migration rates. (a) The effect of TMP on HUVEC migration was detected by wound healing. Photographed and observed at 0 h and 24 h time points. (b) Quantitative analysis of wound healing area. H2O2 significantly inhibited migration of HUVECs, while TMP at 10, 20, and 40 |

TMP inhibits oxidative damages in H2O2-stimulated in HUVECs. (a) mROS generation in HUVECs was determined by MitoSOX Red assay. (b) The mROS fluorescence intensity index was presented as the percentage of the control group. H2O2 significantly promoted mROS production of HUVECs, while TMP at 10, 20, and 40 |

Effect of TMP on MDA and SOD activity in H2O2-injured HUVECs. (a) MDA levels of the control group, H2O2 group, and TMP groups. H2O2 significantly increased MDA levels of HUVECs, while TMP at 20 and 40 |
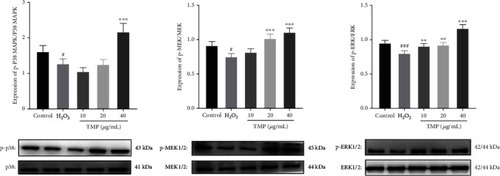
Effect of TMP on protein expression of p38, p-p38, MEK1/2, p-MEK1/2, ERK1/2, and p-ERK1/2 in HUVECs. Expression ratios of p-p38/p38, p-MEK1/2/MEK1/2, and p-ERK1/2/ERK1/2. Values are presented as means ± S.D. ( |
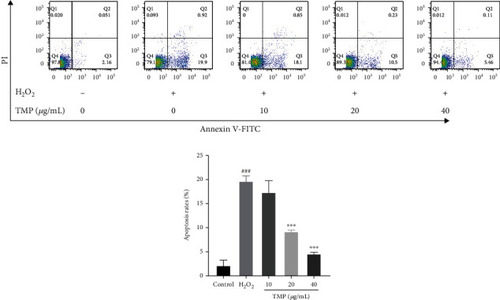
Effects of TMP on apoptosis of HUVECs. Flow cytometry detection of HUVEC apoptosis scatter plot and apoptosis rate. Values are presented as means ± S.D. ( |
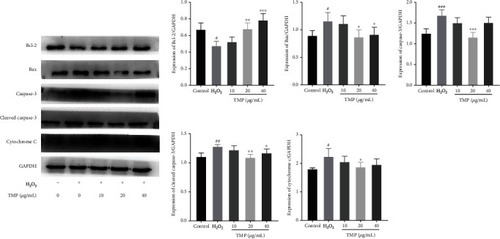
Effect of TMP on protein expression of Bcl-2, Bax, caspase-3, cleaved-caspase-3, and cytochrome c in HUVECs. Expression ratios of Bcl-2, Bax, caspase-3, cleaved-caspase-3, and cytochrome c. Values are presented as means ± S.D. ( |

Effect of TMP on insufficient angiogenesis in Flik zebrafish embryos. (a) The 1 dpf Flik zebrafish larvae were treated with 0.1% DMSO, 0.2 |
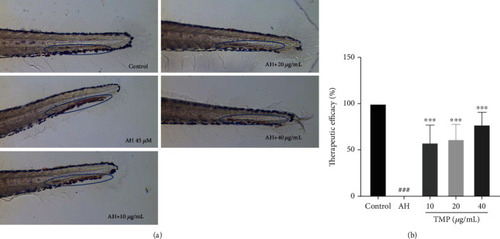
Effect of TMP on AH-induced thrombosis in zebrafish larvae. (a) The 5 dpf zebrafish larvae were treated with 0.1% DMSO, 45 |
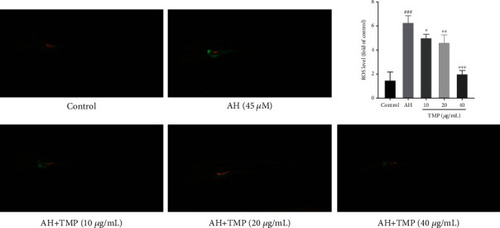
Effects of TMP on ROS levels in AH-treated zebrafish. Values are presented as means ± S.D. # |
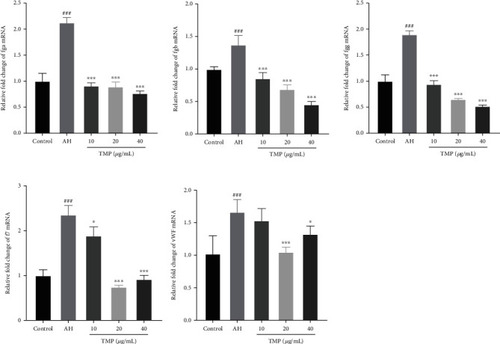
Effect of TMP on the related mRNA expression of platelet activity and coagulation cascade. TMP inhibited PTK787-induced fga, fgb, fgg, vWF, and f7 mRNA expression. Values are presented as means ± S.D. ( |

Protective endothelial injury and antithrombotic mechanisms of TMP. TMP can inhibit H2O2-induced HUVECs damage, promote the expression of MAPKs pathway proteins, inhibit oxidative stress and apoptosis, and protect endothelial cells. Meanwhile, it protects zebrafish from insufficient angiogenesis and inhibits the coagulation cascade, thereby antithrombotic. |