
Image
|
Figure Caption
Figure 2
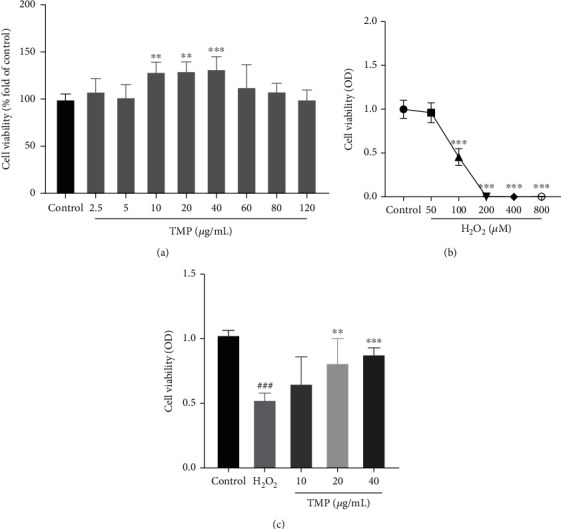
Detection of cell viability by MTT assay. (a) The effect of TMP on the viability of HUVECs. (b) The effect of H2O2 on the viability of HUVECs. (c) The viability of H2O2-induced injury following treatment with TMP at different concentrations. Values are presented as means ± S.D. (
Acknowledgments
This image is the copyrighted work of the attributed author or publisher, and
ZFIN has permission only to display this image to its users.
Additional permissions should be obtained from the applicable author or publisher of the image.
Full text @ Oxid Med Cell Longev