
Image
|
Figure Caption
Figure 5
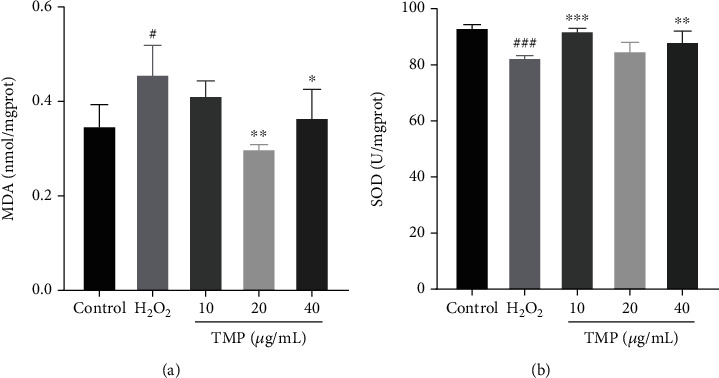
Effect of TMP on MDA and SOD activity in H2O2-injured HUVECs. (a) MDA levels of the control group, H2O2 group, and TMP groups. H2O2 significantly increased MDA levels of HUVECs, while TMP at 20 and 40
Acknowledgments
This image is the copyrighted work of the attributed author or publisher, and
ZFIN has permission only to display this image to its users.
Additional permissions should be obtained from the applicable author or publisher of the image.
Full text @ Oxid Med Cell Longev