FIGURE SUMMARY
Title

Long lasting anxiety following early life stress is dependent on glucocorticoid signaling in zebrafish

Authors
Chin, J.S.R., Phan, T.N., Albert, L.T., Keene, A.C., Duboué, E.R.
Source
Full text @ Sci. Rep.

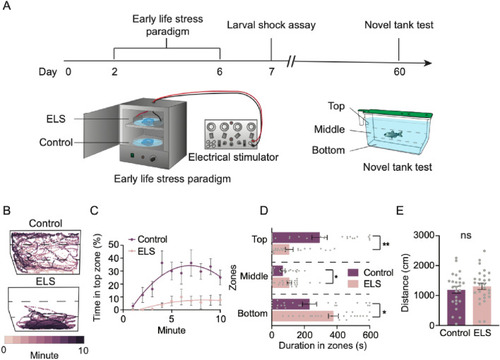
ELS results in exacerbated stress responses in adulthood. (A) Timeline of ELS and behavior experiments and illustrations of the ELS setup and novel tank test. (B) Representative swim trajectories of an individual control and ELS fish revealing that while control fish explored most of the tank, ELS fish swam more at the bottom of the tank. (C) Percentage of time spent in the top zone each minute throughout the 10-min recording. Over time, control animals gradually explored the top zone more frequently than ELS animals. (D) Compared to controls (n = 25), ELS adults (n = 27) spent less time exploring the top (Unpaired t test, p = 0.0003), and more time exploring the bottom (Unpaired t test, p = 0.0038) and middle (Unpaired t test, p = 0.018) zones. (E) Distances travelled were not different between controls (n = 25) and ELS (n = 27) animals (Unpaired t test, p = 0.46). Error bars show ± standard error of the mean. Asterisks denote statistical significance (*p = 0.05, **p = 0.005). ns denotes no significance.

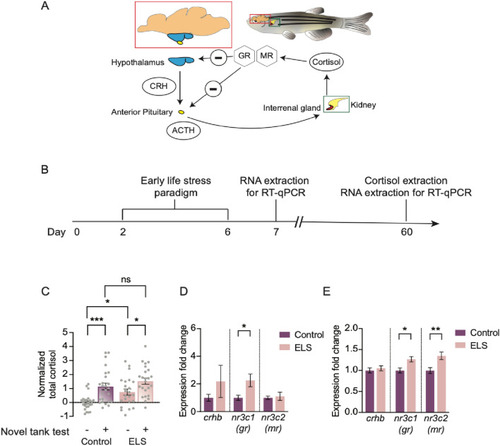
HPI axis is impacted in ELS. (A) The HPI axis, the main stress pathway, and its main genes and effectors. Brain of zebrafish is shown in the red bounding box. Within, the hypothalamus (in blue) and the anterior pituitary (in yellow) is shown. During stress, the hypothalamus signals to the anterior pituitary via CRH, and the anterior pituitary signals to the interrenal gland (shaded in red within the head kidney enclosed in the green bounding box) via ACTH. Cortisol is released from the interrenal gland and binds to GR and MR to negatively regulate its release. (B) Timeline of ELS and experiments performed. (C) Basal cortisol levels (−) were increased in ELS animals (n = 23) compared to controls (n = 25) (One-way ANOVA followed by Sidak’s multiple comparisons post-hoc test, p = 0.044). Elevated cortisol in response to stress (+), after the novel tank test, remain intact in control (n = 25, One-way ANOVA followed by Sidak’s multiple comparisons posthoc test, p = 0.00040) and ELS adults (n = 24, One-way ANOVA followed by Sidak’s multiple comparisons post-hoc test, p = 0.034). Cortisol levels after stress were no different between controls and ELS animals (One-way ANOVA followed by Sidak’s multiple comparisons post-hoc test, p = 0.54). (D) Quantitative real-time PCR of 7 dpf control (n = 9) and ELS (n = 8) larvae revealed increased gene expression levels of gr in ELS animals (Unpaired t test, gr: p = 0.018). No significant differences were found in expression levels of crhb and mr (Unpaired t test, crhb: p = 0.31, mr: p = 0.74). (E) At 60 dpf, gene expression levels of gr and mr were increased in brains of ELS animals (Unpaired t test, gr: p = 0.0064, mr: p = 0.0023), and no difference in crhb expression levels (Unpaired t test, p = 0.73) were observed, compared to controls. N = 9 per group. Error bars show ± standard error of the mean. Asterisks denote statistical significance (*p = 0.05, **p = 0.005, ***p = 0.0005). ns denotes no significance.

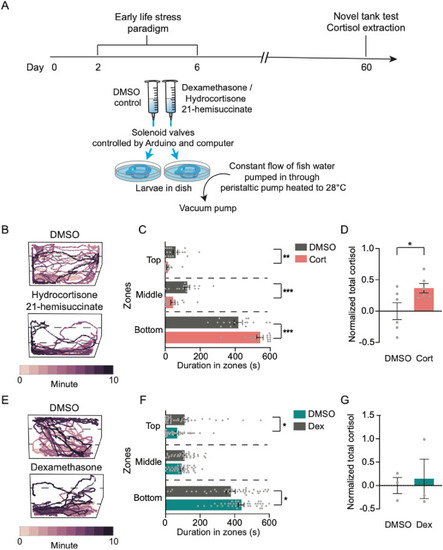
Treatment with corticosteroid receptor agonists in early life induces adulthood anxiety. (A) Timeline of drug-treated ELS and experiments conducted. A schematic diagram of the setup is presented below the timeline. (B) Representative swim paths of 60 dpf controls (DMSO) and hydrocortisone 21-hemisuccinate- (Cort) treated animals. Drug-treated individuals tend to spend more time at the bottom of the tank. (C) Total duration spent in the bottom zone of the novel tank was significantly increased in Cort animals (Unpaired t test, p = 0.0001), and decreased in the top (Unpaired t test, p = 0.0026) and middle (Unpaired t test, p = 0.0002) zones, compared to control DMSO. N = 17 per group. (D) Basal cortisol levels were significantly higher in Cort animals than control DMSO siblings (n = 6 per group, Unpaired t test, p = 0.038). (E) Representative swim paths of 60 dpf controls (DMSO) and dexamethasone- (Dex) treated animals. Drugtreated individuals tend to spend more time at the bottom of the tank. (F) Quantification of durations spent in top, middle, and bottom zones of the novel tank test revealed that Dex animals spent more time in the bottom zones (Unpaired t test, p = 0.025), and less time in the top (p = 0.035) than control DMSO animals yet no difference was observed in time spent in the middle (Unpaired t test, p = 0.11). DMSO: n = 38; Dex: n = 40. (G) Measurements of basal cortisol levels were no different between Dex and DMSO animals (n = 3 per group, Unpaired t test, p = 0.77). Error bars show ± standard error of the mean. Asterisks denote statistical significance (*p = 0.05, **p = 0.005, ***p = 0.0005). ns denotes no significance.

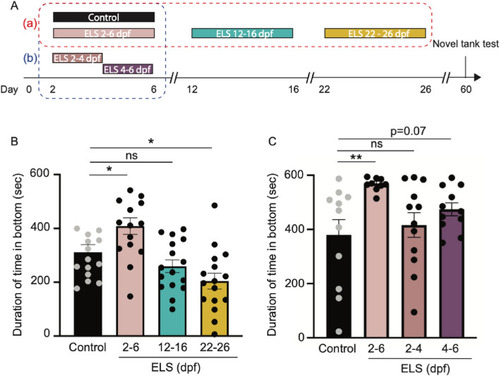
Chronic stress in a time window between 4 and 6 dpf is critical to impact behavior later in life. (A) Timeline of ELS paradigm and novel tank test. Different groups of larvae were subjected to ELS at different ages. In group (a) (red box), larvae were placed in ELS paradigm at 2–6, 12–16, or 22–26 dpf, alongside same aged and unshocked controls. In group (b) (blue box), larvae were placed in the paradigm at 2–6, 2–4, or 4–6 dpf, while control siblings remained alongside in the incubator throughout the 5 days. (B) Quantification of duration spent in the bottom zone of the novel tank test at 60 dpf suggest that only chronic stress during the 2–6 dpf period caused increased bottomdwelling behavior, and not at later times. Multiple unpaired t-tests were performed between control and ELS siblings at three time windows. Control vs. ELS 2–6 dpf : p = 0.014; Control vs. ELS 12–16 dpf: p = 0.081; Control vs. ELS 22–26 dpf : p = 0.0066. (C) Quantification of durations spent in the bottom zone of the novel tank suggest that stress between 4 and 6 dpf may be sufficient to cause increased bottom-dwelling behavior later in life. Statistical analysis done using multiple unpaired t-tests were performed between control and ELS siblings at three time windows. Control vs. ELS 2–6 dpf: p = 0.0026; Control vs. ELS 2–4 dpf: p = 0.31; Control vs. ELS 4–6 dpf: p = 0.07. Controls: n = 11; ELS 2–6 dpf: n = 10; ELS 2–4 dpf: n = 12; ELS 4–6 dpf: n = 11. Error bars show ± standard error of the mean. Asterisks denote statistical significance (***p = 0.0005, **p = 0.005, *p = 0.05).

Acknowledgments
This image is the copyrighted work of the attributed author or publisher, and ZFIN has permission only to display this image to its users. Additional permissions should be obtained from the applicable author or publisher of the image. Full text @ Sci. Rep.